DHQ: Digital Humanities Quarterly
2022
Volume 16 Number 3
2022 16.3  |  XMLPDFPrint

Heterochronologies: a platform for correlation and research in temporal graphics

Johanna Drucker , Department of Information Studies, UCLA ORCID logo https://orcid.org/0000-0002-6617-9088
Peter Polack , Department of Information Studies, UCLA ORCID logo https://orcid.org/0000-0001-7323-0630
Pietro Santachiara , Department of Information Studies, UCLA ORCID logo https://orcid.org/0000-0002-5569-2177

Abstract

The difficulty of integrating the data, metadata, and classification schemes produced across a wide geographic, historical, and cultural variety of institutional sites and practices was a major impetus for the creation of Linked Data (LD). The promise was to make diverse sets of data interoperable through subscription to an array of standardizations while leaving the original data intact. These operational requirements enable interoperability at the expense of specificity, and require considerable resources for implementation. While LD supports connection and access across disparate data sets, it is not focused on the intellectual issues that have to do with enabling the correlation and comparison of diverse ontologies, or preserving and exploring their epistemic and cultural specificity — issues essential to humanistic study. In addition, LD is exclusively concerned with linguistic data, and can hence not be applied to information that is expressed in graphical form. Contrastingly, the Heterochronologies project regards temporality as a concept expressed epistemically through various culturally-specific, authoritative ontologies, which are instantiated by graphical representations such as chronologies and timelines. The project concentrates on extracting computationally tractable structured data from historical images so that the underlying ontologies may be compared without subsuming them into a hegemonic data model. In this sense, the Heterochronologies project is an exercise in comparative ontology.

In this paper we describe the factors that motivated the project; its various epistemological underpinnings, as well as the methodological approach that guided its development; the phases of our work; and the contributions that emerged from the project. Though currently still in development, its culmination is a digital platform — the Time Capsule — that supports comparative pedagogy, and in so doing demonstrates both validity and relevance of a few fundamental notions: a) structured data can be systematically extracted from graphical structures with a logical approach; b) comparisons of temporal schemes can be supported by a digital platform that considers them as instantiations of ontologies that need not be reconciled to a single standard; c) the historical and cultural specificity of these ontologies can be exposed and analyzed using digital means.

Project Overview

Structured data in graphical formats present certain challenges for computational systems rooted in language (Semantic Web) and metrics (quantitative data); and yet, many forms of information are expressed in graphical form as instantiations of ontologies that originate from specific cultural values and points of view. The history of graphic expressions for time-keeping stretches from early tallies of the phases of the moon to current automated systems for tracking temporal phenomena at nano-to-macro scales; these temporal records often serve practical purposes, but they also encode belief systems. This is reflected in the sequential cycles of the Mayan “Long Count” calendar and the Judeo-Christian tradition of dividing time into periods “before” and “after” the birth of Christ. In Western culture, Biblical chronologies dominated representations of human history until the advent of “deep time,” which was introduced by James Hutton and others in the late 18th century as part of the emerging science of geology. Hutton inherited a time scale that had been in place from late antiquity, codified through such widely-used references as the work of Bishop James Ussher. In his radical extension of time’s scale, Hutton altered the ideological as well as metrical frameworks for historical understanding. The graphical formats in which these schemes are expressed are structured data, but do not readily lend themselves to direct processing by computational means.
For research that acknowledges these historical shifts in understanding and representing time, identifying which chronologies adhere to a scientific understanding of time is not the main concern. Every graphical expression of a chronological scheme is historical evidence of a descriptive system, which is useful to scholarship concerned with how time has been conceived in particular historical contexts. Though geology requires a different chronological framework than that of Dakota Winter Counts or early Roman calendar systems, each of these schemes expresses culturally specific understandings and epistemologies of chronology which demonstrate unique approaches to accounting for chronological events. Respect for the specificity of these schemes and for the cultural otherness of diverse past and present viewpoints is essential for the study of human knowledge in its multiplicity of forms. However, it is not trivial to translate this respect for ontological difference into sense-making and analytic tools.
With this respect for specificity, and its computational representation as a guiding concern, the Heterochronologies project puts forth a few fundamental notions. First, it proposes to treat graphical representations of time as structured data that can be made tractable, analyzed, and used comparatively in a digital environment; this is a humanist project that requires innovative digital intervention. Second, it supports the systematic analysis of disparate chronologies with an attention to their unique cultural differences. Indeed, this project was motivated by the conviction that different chronologies should be studied without subsuming them into a single standard or framework. In this regard, it is a project in dialogue with Linked Data initiatives that specify crosswalks into a uniform standard as a way to make data interoperable. The logical and procedural standardizations established by the Linked Data model — RDF standards for structures, domain ontologies for semantics, and vocabularies for authority control — lose sight of the specificity and cultural contexts of the originating data models by requiring the approximated translation of existing semantic structures into prescribed ones. We believe an ethical issue is raised by this translation and its subtle but actual assertion of a hegemonic approach.
A key functionality that inspired the Heterochronologies design, and which allows it to enable interoperability while avoiding translation, is the ability to specify floating correlations, or discrete relationships between points in different schemes of representation that enable them to be compared. The idea of a floating correlation is that specific points in differently structured schemes can be linked without requiring that the systems share a structure or metric. The single point of correlation allows the rest of the scheme to ‘float’ with its own extension. For example, depictions of the Leonid Meteor Showers of 1833 appear in multiple chronological record keeping systems, each of which is constructed according to its own time scale, with distinct start and end points, and different valuations of the event. The relative position of the Showers in each chronological system can be specified as a floating correlation, and thereby compared across systems, each as its own cultural expression of time. A key benefit of this approach is that it enables the comparison of chronologies relative to an event depicted in each, rather than to a unifying scheme of representation; relationality is allowed to emerge from the data, rather than as a consequence of the establishment of an a priori, unifying scheme which inevitably imposes cultural connotations and biases. For example, Egyptian dynastic periodization can be matched with geological events and Olympiads without all of these needing to be expressed in the Gregorian calendar, and the Winter Counts do not have to take the birth of Christ as the start point for their reference frame.
The aforementioned notions have been operationalized through several activities, or goals, in the Heterochronologies project. The first is by studying chronological systems in their graphical expression to understand how they periodize, value, mark, and represent historical time; in other words, the first activity is to study the graphical structure of these chronologies as intellectual objects. The second is using this study as an exercise in comparative ontologies within their original formulation; the point of this is to make ontologies legible as ideological documents that can be read as value-producing systems. This goal is bound to a third, which is using graphical methods of analysis as research tools — analyzing formal, schematic, and visual representations of ontologies as the basis of systematic inquiry into their characteristics. The final goal is to provide a digital platform for organizing chronological information for research or pedagogical purposes. Such a software environment supports the analysis of chronological systems and their graphical forms, including how they periodize, value, mark, and represent historical time. This goal resulted in the development of a prototype for a Time Capsule work environment that includes a Collection of examples and a Chrono-Referencing system for organizing floating correlations in a digital platform.
Overall, the unique contribution of the Heterochronologies project has to do with the methodological approach through which it treats visual representations of time as structured data that may be serialized in a JSON data structure to enable cross-case comparison without requiring the subsumption of the various logical and semantic elements that compose such representations into a hegemonic system. In other words, this project allows correlation of data that is expressed graphically by chronologies — historic, contemporary, existing, and not yet created — while preserving the specific characteristics of their originating contexts of production. In this sense, though this project is focused on chronologies, the methodological approach and analysis are meant to be extensible to other kinds of ontologies. While we developed this project and the tool in which it culminates with the general public in mind, its scope is to support any and all research projects that make visual temporal representations their object. Academic researchers, librarians, teachers, students, and lay persons are all potential users of the Time Capsule tool we present in this paper.

Approach and Requirements

Epistemological Considerations

Certain theoretical tenets inform the design of comparative tools and methods that this project aims to support. First, the value expressed by graphical representations of time — i.e., timelines and chronologies — is a function of the relationship between frames and elements within them [Drucker 2009]. A frame is a defining boundary – graphical or conceptual – which can establish a unifying scheme of reference or an epistemological context that supports an arrangement of elements a) in relation to one another; and b) in accordance with certain logical rules and semantic conventions. Elements arranged in relation to a frame express underlying data structures and values, enabling them to provoke sense-making according to ontological and epistemological regulations that they enact.[1]
For the purposes of this project, we regard frame and elements as formally distinct types of objects serving interdependent roles that can be represented computationally. Following the premise that graphical elements are involved in part-to-whole and part-to-part relations, and that their meaning is instantiated by those relations, any part considered for analysis should also be analyzed in relation to other parts and wholes that inform its significance. Furthermore, the formal distinction between frame and elements should be respected by and reflected in the digital environment to enable comparison, including the operations supported by the system as well as the underlying computational aspects at both logical and syntactical level. This enables the project to support comparison between diverse entities that exhibit the same types of relationships — i.e., element to element, frame to frame.
Overall, this project acknowledges the fact that timelines and chronologies are artifactual representations of time charged with humanistic and symbolic value. Consequently, comparison between representations of time should not forgo the meaning or specificity of values proper to each. However, rhetorical aspects of chronologies, as well as their contextual and historical circumstances of production and use, are difficult to represent in data structures that could be analyzed and compared. Formal data structures — especially generalizable ones — are not particularly suited to encoding certain features of graphical expression. Aesthetic dimensions of color, tone, or line weight may be easily overlooked — not to mention such features as a Cherubim holding curtains aside to reveal an information-bearing element (Fig. 1). These features play a fundamental role in the interpretation of individual chronologies, evidencing their production and use as cultural artifacts. Acknowledging this, this project is committed to respecting and preserving rhetorical aspects of chronologies when transposing into computational representations. This requires not only considering them at all stages of the project development, but also acknowledging their significance as terms that enable comparison.
As mentioned, one way this project departs from Linked Data is its commitment to comparison, connection, and enrichment of data through emergent semantic interlinking, rather than requiring entities and relations to conform to a uniform, prescriptive set of definitions established in advance of their analysis. The ways in which Linked Data establish relationality are problematic, in that the translation of local entities, whether logical or semantic, into LD seldom resolves in the direct correspondence of synonyms — a fact for which LD makes no provisions. The result is loss of information at frame and element levels, which inevitably contributes to the misrepresentation of artifacts, their features, their meaning and their overall specificities. This is not conducive to the instantiation of meaningful comparisons, since the entities being compared are not the original ones. Furthermore, the act of subsuming entities into a dominating system has hegemonic effects, in the sense that a given system can preclude the representation of ideas that do not fit into its scheme. In this sense, operating under such premises results in a loss of accuracy, relevance and specificity, indeed a loss of difference, in order to acquire of a degree of homogeneity that redefines the descriptions of the entities and is inevitably carried over to the comparison itself. Conversely, both quantity and quality of difference, as specificity, must be preserved.
Image of a circular disc
Figure 1. 
Weigel - Discus Chronologicus

Synchronization and Correlation

The approach used in the Heterochronologies project preserves the specificity of each system — i.e., its mode of presentation, graphical features, and cultural contexts — while supporting correlations and comparisons. The project is designed so that operations carried out by the system enable comparison of representations without the need to either translate or subsume individual chronologies and comparative processes into a dominating epistemological paradigm. Constitutive difference is to be identified and respected without being reduced, both within individual representations and in the comparative act. Constitutive difference suggests that specificity is inherent in an artifact, but able to be abstracted from its particular features into a systematic means of comparison. Our approach to using this concept was to create a descriptive vocabulary from graphical images that could be used as the basis of a diagrammatic structure from which quantitative metrics could be derived. For example, a temporal unit in a biblical timeline would have a different graphical and thus quantitative value than in a geological one, but its value within the source graphic could be specified within the system of frames, axes, spans, intervals, and other components by which it was constituted. While this sounds abstract, it was meant to provide a way to generate quantitative value within each graphical example on its own terms.
One intuitive approach to comparing graphical representations of time that respects constitutive difference is to align these representations around chronological events that they have in common. To reiterate, this approach invokes the concept of floating correlation across points of reference in distinct contexts, chronologies, and representations, rather than within a single unifying framework. By establishing common points of reference across contexts, distinct chronologies can be aligned and synchronized relative to these reference points. The already-mentioned 1833 Leonid meteor shower is one such common point of reference: it is an event that has been witnessed, recorded, and represented in different yet similar ways by a number of cultural groups, and for this reason it provides the opportunity to compare multiple representations of time by aligning them according to a common feature. By aligning Native Americans’ Winter Counts (Fig. 2, Fig. 3, Fig. 4) records of the Leonid meteor shower, the temporal view of events is extended in a way that enables comparison of structural, logical and topical elements across different contexts of representation and documentation. Points for alignment may be identified using automated processes of data analysis, but the Heterochronologies system is designed to support the manual selection of fixed events, since it is conceivable that users might want to specify such points in their analyses.
Image of a flyer that reads "natural phenomena"
Figure 2. 
From Lakota Winter Counts: The Teacher's Guide
image of a wood engraving of a meteor shower
Figure 3. 
Wood engraving by Adolf Vollmy (1889)
image of cave paintings
Figure 4. 
The Long Soldier Winter Count, note the “falling stars” at the bottom, five squares in from left.
Synchronization of chronologies through floating correlations between temporal reference points is a useful functionality, but it does not solve all challenges of chronological comparison. For instance, a linear representation that displays the succession of ancient Egyptian dynasties cannot be synched with Minard’s representation of Napoleon’s 1812 march to and retreat from Moscow (Fig. 5) because of lack of common temporal reference points. Similarly, other temporal representations may, conceivably, express fundamentally different conceptions of time — e.g., linear versus circular/cyclical — that may not be able to be related through alignment of fixed events. With a lack of common temporal measures and structures, distinct representations of time are temporally incommensurable. However, other features may still be compared even in such cases: formal, structural, semantic, logical, rhetorical; types of data structures, distributions, intervals, quantity and quality of data points, and so on. Some timelines and chronologies may be aligned because they share, for instance, the same definition of years, months, days, or periods of time. Therefore, in the absence of shared temporal reference points, temporal markers and descriptors like dates can be leveraged as coordinates that enable synchronization.
image of a line chart with red and black lines
Figure 5. 
Minard - Carte figurative des pertes successives en hommes de l’Armée Française dans la campagne de Russie 1812–1813
Still, while markers of temporal events or intervals can be used to identify comparable features of disparate chronologies, they do not ensure that these chronologies can be easily synchronized. For instance, the “Painting” and “Plumbing” tasks listed in the Ganntt chart of Fig. 6 (items 9 and 7 from the bottom, respectively) may be formally represented as having been completed at the same time, but the metric is not sufficiently granular to support correlation of information at a level that could guarantee precise synchronicity — the bars and bands are too crude. While activities that take place in time are represented here within time buckets or divisions, the actual unfolding of the activity may not happen within such discrete separations. In fact, time can be subdivided infinitely, and determining the points on which comparisons can be made within such divisions raises metaphysical as well as epistemological problems. At one extreme, the chronology titled “Eternity to Eternity” (Fig. 7) provides an edge case for thinking about the types of comparisons which can be enabled and supported when different extensions of time are put in relation. The challenge of periodization within such an incalculable time scale poses certain paradoxes — can the infinite be segmented when the start and end points referenced are basically indeterminate? These challenges quickly shift from theoretical abstractions to practical dilemmas in creating data representations. How can such subdivisions of “eternity” be translated into specified intervals in a JSON format?
Altogether, uncertainty remains an important factor to acknowledge when identifying points of alignment between chronologies. For this reason, the Heterochronologies system adopts a probabilistic approach to chronological comparison and alignment. Operations for contrasting, comparing, and correlating graphical representation of time should not be presented as fact, but with confidence intervals that indicate degrees of uncertainty. This approach enables the comparison of chronologies that employ non-discrete representations of time, with values that are not explicitly specified.
image of a Gantt chart
Figure 6. 
Gantt Chart
image of a chart from eternity to time
Figure 7. 
Booth - A Chart On The Course Of Time From Eternity To Eternity

Project Development

Defining a Problem Set

The first phase of project development involved the analysis of a problem set — a group of about a dozen images, each exhibiting a different graphical representation of time. The selection of the problem set was informed by the need to a) create a representative selection of approaches in terms of scale, graphical structure, cultural points of view, and other features, and to b) collect edge cases that would challenge, complicate, or otherwise highlight key conceptual or formal aspects of chronologies. The problem set was not meant to be exhaustive in any way, but rather to raise problems for existing approaches that concern the Heterochronologies project, and in this sense to provide fundamental constraints that must be considered for comparing diverse representations of time. These are from Western, Russian, Chinese, Native American cultures, and date from the early Renaissance (with roots in antiquity) through to the early 20th century. Throughout research, we referred to the images in this problem set to iteratively develop conventions for describing the logical, graphical, and semantic structures entailed by representations of time. The problem set includes both chronologies — date stamped, discrete, event-specific representations of historical events — and timelines — continuous temporal phenomena in a unified linear format. Although the images in the problem set share certain features of continuous and linear representations of time, we selected examples that posed challenges for comparison; thus, while some of the images are more strictly concerned with temporal relations, others emphasize relationships among historical events.
As we started thinking about the premises under which comparison of graphical representations of time could be carried out and the computational processes and environments that might host it, we concentrated on defining the types of information presented by such artifacts as well as the ways in which that information is represented. Specifically, we focused on identifying and defining a) how meaning is instantiated by timelines and chronologies; and b) the visual/logical conventions and structures within them that represent and expose difference. The problem set was designed to provide a wide range of data structures with a variety of metrics.
Some key issues emerged from our iterative analysis of these examples (the complete details of which are included in the Appendix). These included formal problems involved in qualifying representations with respect to a comparative model, and representational problems involved in transposing graphical elements into a computational syntax that would make them tractable for analysis. These issues were: the role of grids in the establishment and identification of synchronicity; the presence of coexisting timelines within single artifacts; overlapping axes and their challenging of the definition of frame; implicit axes; heterogeneity of axes’ scale (granularity); importance of rhetorical, sometimes decorative, elements to the establishment of value/meaning; ‘orientation’ and direction of reading and interpretation; the importance of fixed points in the synchronization of chronologies; ‘soft’ relations and non-Boolean data; heterogeneity of data types (Boolean/non-Boolean) converging in one chart; need for representing uncertainty.

Graphical Approach/Strategies

After selecting the problem set, we identified graphical, structural, and semantic elements in the chronologies and formulated a descriptive vocabulary — or notation system — of components that were represented across instances in the problem set. Here, graphical methods of analysis were used as a primary mode of knowledge production, which further developed our understanding of project needs and challenges [Drucker 2014]. This taxonomy demonstrated the possibility of consistently defining and hence comparing elements in the chronologies, but it did not adequately account for structural relationships among these elements, nor aesthetic variations. The fundamental taxonomy (described in detail in the next section) included the terms frame (outer border in logical, metrical, and graphical senses); axes (orientation for time sequences and periodization); span (range and intervals of chronology); segments (subdivisions of span that helped identify range and scale); symbols (graphical features, legends, other elements that were glosses on the timeline/chronologies or additions to it); and significant points (known events useful for alignment).
In order to formulate conventions for describing these structural and aesthetic features, we developed a second approach which included the formulation of a markup language or computational syntax that could schematically represent the visual elements in the chronologies. Because a programming language is designed to support the specification of a wider variety of functionalities than the language itself, we could design such a language to specify differences across chronologies that would still adhere to a common scheme of specification. Through following principles of computer programming, such as the insistence on the reuse of code, the elimination of syntactical redundancies, and the modularization of components, we could design such a language to operate as an efficient means of summarizing and comparing elements across the chronologies.

Platform development

The third phase was the design of a conceptual and computational framework that could support the analysis of chronological representations for research and pedagogy. A key principle guiding this design is that components of a chronology are often incommensurable across chronologies, but they can be correlated — either as specific dates or in reference to common temporal events. The challenge here is to perform analysis on linguistic, graphic, or pictorial contents, while still accounting for the structural and syntactic idiosyncrasies of graphical representations. To showcase this approach, we designed mock-ups of a Time Capsule software environment that illustrate how a user might interact with chronologies of interest.
A main feature of the Time Capsule framework is a chrono-referencing scheme that enables floating correlation and temporal synchronization between chronologies. Chrono-References are chronological systems in common use that we selected to serve as substitutable schemes of reference for chronological analysis. These include Gregorian, Julian, Christian, Islamic, Jewish, Egyptian (dynasties), Winter counts, Mayan, and Chinese calendar systems. A second set might include geological time periods (Archean, Cambrian, Ordovician etc.), anthropological/archaeological ones (Bronze Age, Iron Age and so on linked to specific geographical locations), and other domain specific, discipline or task-driven schemes, such as carbon dating. To demonstrate how chrono-referencing might operate, we present the Time Capsule mock-up with a sample of chronologies called a Collection, annotated with Chrono-References. The purpose of the Collection is to demonstrate how a computational framework for comparing chronologies could operate in practice and extend to other objects of study.[2]
To aid this approach, we drew on the substantial precedents for programming languages that are used to specify visual elements, such as the D3 and three.js JavaScript libraries. These code libraries involve a) a syntax for drawing graphical elements; b) certain pre-made functions that produce more complex visual elements, and c) in the case of D3, a data visualization system that enables binding data to graphical elements, and then adjusting them dynamically. Libraries like D3 can be used to produce a wide variety of visualizations using the same components and similar techniques, although with some unifying constraints. To develop a computational visualization with this code library, a programmer envisions certain graphics and functionalities, and then works backward to identify functionalities provided by the library that could produce this result. We envision this method of ‘working backwards’ as an approach to devise a markup language that would allow for comparison between existing visualizations. In short, if we can design a new language to produce a variety of different visualizations, this language can also be used to compare them.
Within this framework, we worked on finding ways to construct existing visualizations out of computational elements. The method of devising a programming syntax raised fundamental design considerations concerning how to specify and relate graphical and structural elements. For example, the axis object in the Gantt chart (Fig. 6) could be treated as a ‘global’ object with attributes that other elements in the chart could ‘inherit;’ or it could be defined as a ‘local’ object with its own unique attributes. Through identifying and discussing design considerations such as this, we assessed the trade-offs and implications for comparing chronologies through these methods. Here, a central concern was to ensure that the constraints and patterns of a programming syntax did not over-determine our scheme of description and comparison. In the case of the axis, for example, the axes were not defined as ‘global’ objects, which would be a convenience for programming, because that would impose a computational design pattern onto the visualization that it does not specify. In all instances, the Heterochronologies environment worked to avoid subsuming specificity and difference into either generality or uniformity.
In the initial version of our programming syntax, classes and attributes were specified for elements which would define their more specific properties. Axis classes, for example, included horizontal, continuous, named, ranged, segmented, and crossed elements, each of which would define the appearance of the axis and the possible attributes it could have. One of these class attributes — crossed — joined elements together so that they could represent multiple attributes of data (also called ‘dimensions’), which would then enable plotting data according to these elements. For the Gantt chart, the axis and table were ‘crossed’ so that data with an axis attribute and a table attribute could be populated among them. Other attributes like segments could take another element as a property, allowing for a kind of nesting or inheritance structure.
Altogether, this exercise in creating a programming syntax could be described as ‘projecting’ a programming environment onto a graphical representation. However, the benefit of this approach lies not so much in its product as its process — recognizing that much of the programming was extracted from the graphical features, not merely projected onto them. Through the devised syntax, graphical and structural elements that could be represented with the same vocabulary were identified and transposed to the new analytical system without losing sight of their specificity. This raised some challenges. As the markup language developed, it became clear that it would be easier to view the specified graphical and structural elements relationally in visual form, instead of as displays of code. This was the motivation for the third approach in the methodology: to draw relational diagrams of the chronologies and their components. At this time, another provisional taxonomy of components was defined that persisted throughout our experiments and discussions.
The design of the relational diagrams was informed in part by visual programming environments where elements can be combined to make other elements. Experiments with the ways in which basic elements could be combined to make new elements draw out these combination sequences. As the diagrams developed iteratively, the taxonomy of components that could represent the patterns was updated. In an approach similar to the development of the programming syntax, the iterative design of the relational diagrams raised considerations and challenges for creating a scheme of chronology comparison and consequently prompted further discussion. At this point, a crucial distinction was made between spans, or graphical extensions that imply directionality or continuity, and sets, which are graphical groupings of other elements that do not imply directionality and continuity. Conventions developed for specifying non-directional relationships between these elements which were still able to account for structural hierarchies that they implied.
This series of iterations on the designs of relational diagrams allowed simplification of their organization and identification of broader structural similarities among them. [See Figures 9, 10, and 11 below.] A graphical system was iteratively designed to enable these structures to be compared in a simplified and intuitive way. In the final graphical system, textual descriptions of elements (e.g., axis, span) are summarized with symbolic glyphs. Instead of representing relationships between structural elements with lines, which tended to imply directionality, overlapping regions are used to indicate constraints that certain elements impose on others, and graphical conventions indicate high-level properties of these constraints, like their segmentations.
Overall, the process of developing a graphical system enabled a grapho-logical analysis of chronologies: the use of a notation system to summarize structural features of chronological representations for visual comparison. The concept of grapho-logical analysis is that of extracting quantitative metrics from the specific structures of chronological representations, which enables these structure to be analyzed and visualized. In other words, it is a method of abstracting structured data from schematic images, which can then be examined for further analysis. By identifying relationships between frame, span, interval, tick-marks or units and other graphic features, and then specifying them in a notation system, the value of any particular element can be analyzed and visualized relative to the whole.
Grapho-logical analysis supports the comparison of chronological representations that involve different specifications or indices of time, but comparable structures for representing time nonetheless. In a biblical time frame, for instance, Creation is dated to 4004 BCE. This allows for an explicit calculation of the year of Christ’s birth and the present, from Adam to Noah and by extension, spans of time in the present. By contrast, the use of historical timeline for events from the colonization of America to the first presidents of the United States is designed on grid that spans only about two hundred years from 1607 to 1800. The units in the second chronology are decades, but they imply a relation to the Gregorian calendar and the birth of Christ as the 0 year. The two timelines can be compared graphically, with the relative value metrically computed. A presidential term of four years has a value when it is located in a span of two hundred years. The same two hundred years of history has a different relative value within a six thousand year span (or within the endless expanse of eternity).
The different scales can also be demonstrated through a graphic comparison. This supports correlation — using the zero year or using the time span of the historical chart next the metric of in “Eternity to Eternity” (Figure 8). The method allows us to see (literally, in visual form) the relationship of one schema to another while also understanding the relative quantitative value of events within each. Presidential terms might diminish in significance relative to the span of eternal timescale, or, by contrast, demonstrate the value of the specific granularity of measures. What is the value of a year? It can be calculated relative to the span to which the year belongs. Generating such metric values supports comparison and correlation — the representation of constitutive difference — without forcing either scheme to be represented in terms of the other. The approach gets at the specifics of value in each scheme (four years of two hundred, two hundred years of six thousand). In this way, grapho-logical analysis offers a schematic presentation of the information and visualizes the relative scales in an immediately graspable format that is also quantitative and computable.
the same chart as above but with a red line in the
								middle
the same chart as above but with a red line in the
								middle
Figure 8. 
While eternity has no end-point, specific intervals (green arrow) and points (red) (Adam to Noah or Year 0) have explicit metrics. These allow for correlation with other chronologies, such as the Historical and Biographical Chart of the United States which correspond to the blue arrow above (starting at approximately 1600, using the same metric scale as the green arrow).

Implementation and Contributions

The Heterochronologies project aims to make several contributions to humanistic study of graphical expressions of time-keeping: a) a descriptive vocabulary that supports the specification of structural features in chronological representations; b) a grapho-logical system for analyzing these features; c) a computational framework for correlating and comparing these features, in the form of a digital workspace for research and pedagogy built on this computational framework. The project is focused on the analysis of the specific features of these chronologies in structural and semantic terms, and gave rise to the concept of a computational framework that supports the interactive analysis of chronologies, exemplified by the Time Capsule — a speculative digital workspace where the analytic, descriptive, and comparative methods are combined in a platform for research and pedagogy.

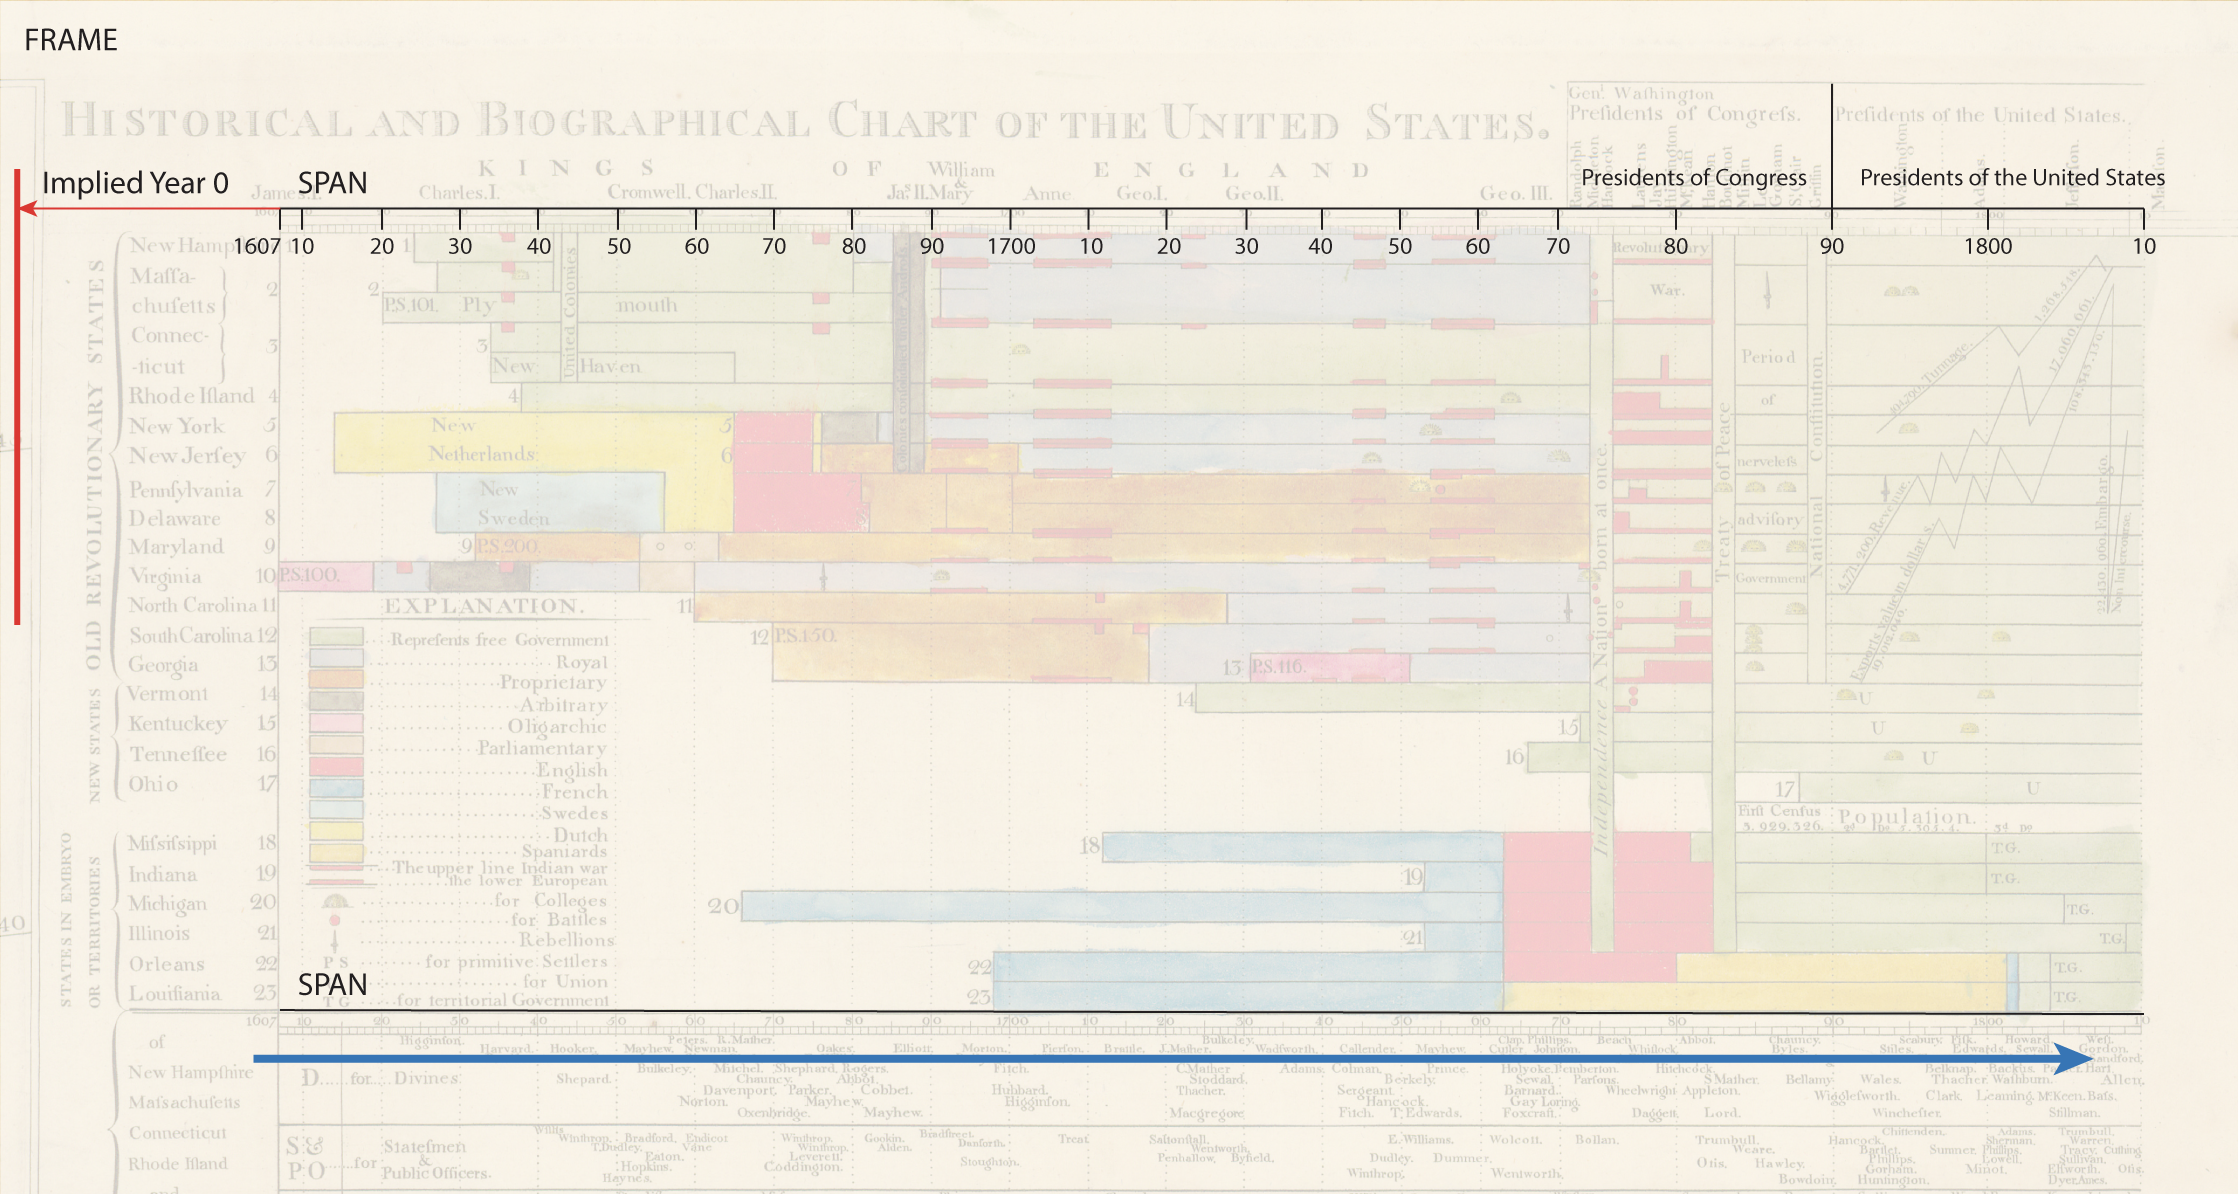
Descriptive Vocabulary

As mentioned above, the project began with creation of a descriptive and analytic vocabulary of the structural and semantic components of graphical chronologies. The vocabulary is meant to be general enough to apply to most individual images but specific enough to provide analysis of features in each visual representation.
The structural components identified were:
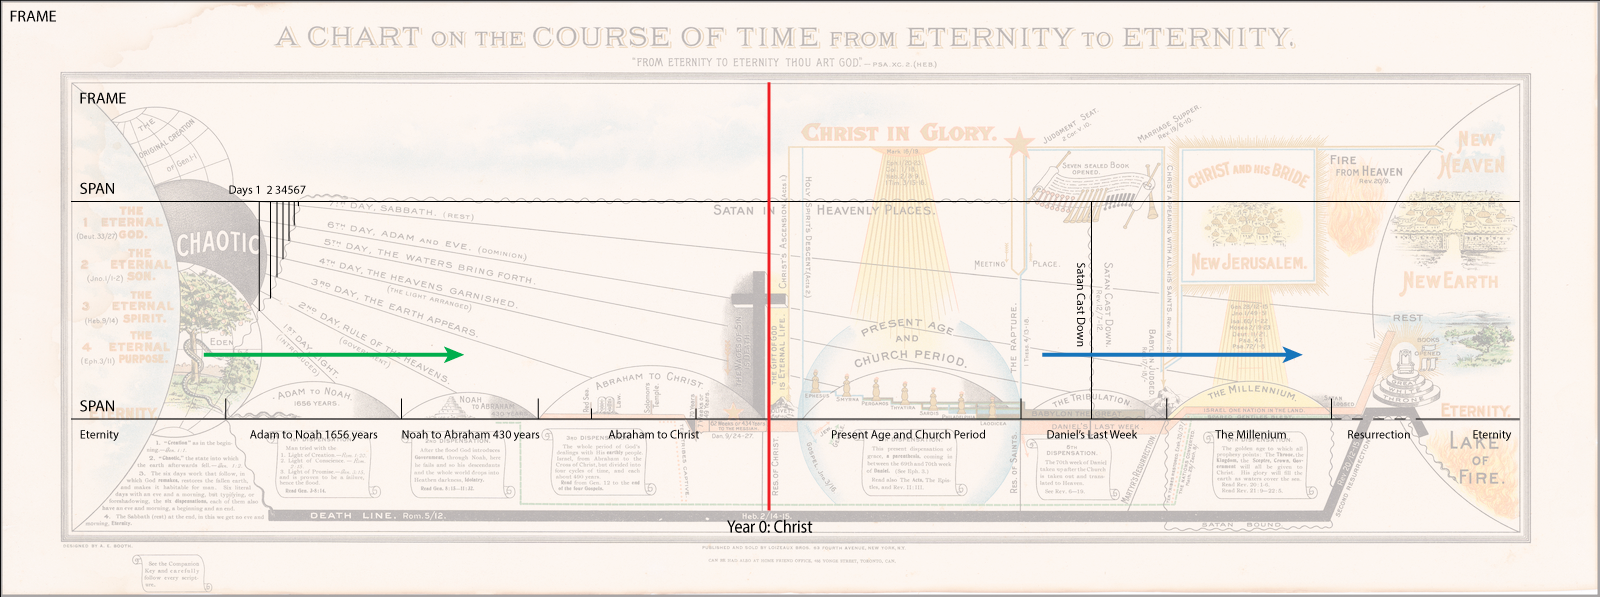
  • frame (outer border as a logical, metrical defining boundary);
  • span (with extension, range, and marked intervals);
  • axis (main line of temporal development or sequence with a directional orientation);
  • segments (each a span with its own range and scale);
  • symbols (signs and elements used in a legend as a graphical notation system for
  • information);
  • significant/fixed points (known events that can be used for alignment across chronologies);
  • set (graphical grouping);
  • quantitative value (scale or metrics);
  • implied components (for example, longitude when only latitude is explicitly represented).
The semantic components are the units of time:
  • lifetimes;
  • historical events;
  • periods defined by features like reigns of monarchs or establishment of nations or empires;
  • cycles of seasons or calendrical systems; and
  • others within an emerging typology derived from the chronologies.[3]
A typology of graphical structures is also useful for standardizing description of the chronologies and relating them to data structures:
  • tree (branching and hierarchical);
  • river (flow, unclear segmentation, and vague or approximate metrics);
  • grid (clear crossing points, or column/row values, and explicit metrics);
  • score (synchronicity and a topological structure);
  • bars (chronologies and spans, more or less explicit metrics);
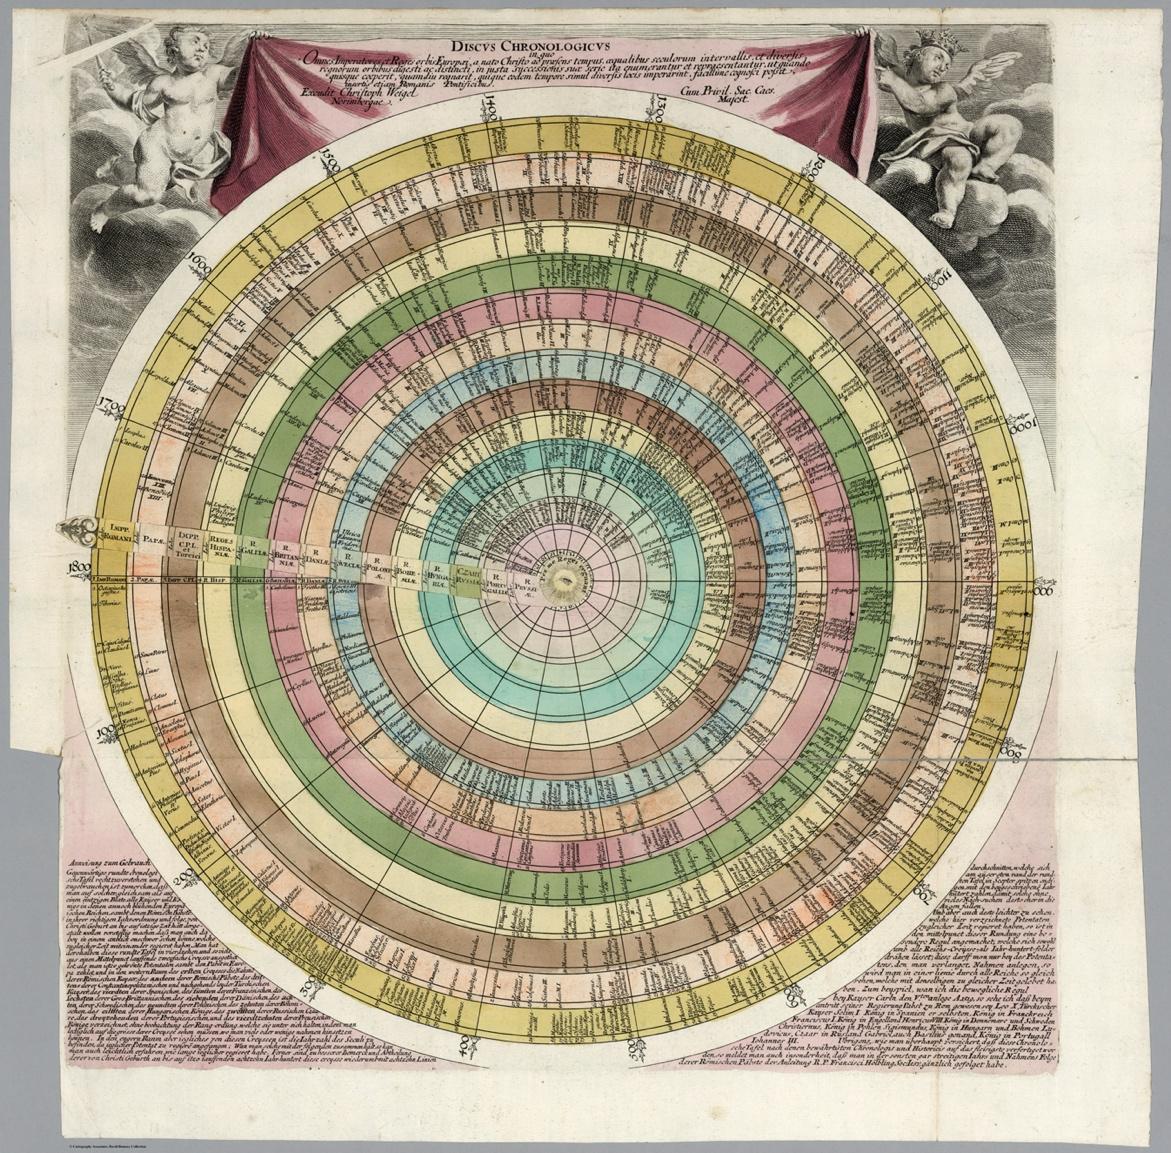
  • segmented wheels and disk;
  • other formats derived from examples.
This descriptive vocabulary provides the basis for terms of comparison between representations of chronologies: from point to point; among data values; to allow visualizations to be embedded into or overlaid on each other; and to support a relational model of contrast and correlation. One principle of contrast guiding the project is that data points have value in relation to a calculable ratio of granularity and density. In addition, these points generally carry an attribute specifying degrees of uncertainty. Some degrees of uncertainty are merely a factor of granularity: the Battle of Hastings takes place in 1066, but the actual span of this event in terms of preparation, action, intervals, continuity, aftermath and other factors make mapping it into a specific calendrical system difficult if not impossible. Uncertainty can arise from any number of factors: lack of precision in the information, or in the phenomenon represented, or in the representation.

Grapho-logical analysis

In parallel with developing a descriptive and analytic vocabulary, the project made use of various graphical methods for analyzing the structures and representation of chronologies. An initial question was whether formal data could be extracted automatically from the visual representations, by using optical character recognition (OCR) or other approaches to automated graphical analysis, or whether formal data could be specified by a custom notation system. Specifying the requirements of such formal approaches to data extraction and representation of structure led to the development of a grapho-logical notation system designed to facilitate and represent comparison and correlation of structural components. Grapho-logical analysis supports a connection between graphical images (timelines and chronologies) and logical structures that can be represented in computational terms, enabling their subsequent visualization and analysis. This addressed the challenge of identifying the ways in which the formal structures of chronologies could be represented as logical structures that are legible to computational processing. By determining the components of the logical structure, the typology of relationships among the components, and ways for these components of the formal structure to become a data structure, this method addressed ways in which a data structure could be abstracted and/or extracted directly from an image.
The grapho-logical approach to comparison also provides a formal notational scheme as a shorthand for display of that analysis within the Time Capsule workspace (see figures below). Grapho-logical analysis is based on the components and factors of comparison outlined above (axes, orientation, spans, events, and segments). For instance, start-points and end-points of an axis provide a crucial feature on which to make correlations. (The space of time from Creation to the Flood, for instance, is different from that defined by fixed dates such as 1700-1890 or that indicated by a span from Eternity to Eternity.) One crucial tenet of belief guiding the project has been that graphical methods of analysis are primary modes of knowledge production, and demonstrating this is important. The graphical elements of the original documents are considered essential information, even when they are abstracted into a second-order grapho-logical system. This notation scheme is analytic (it shows how the relation of structural features in the chronologies can be understood in a distilled, diagrammatic, mode) and representational (it encodes that analysis in a visual shorthand). It is designed to represent constitutive difference across representations, rather than to indicate the structure of these representations definitively.

The Time Capsule

Through acknowledging the potential of (1) floating correlations to make disparate chronological schemes of reference comparable, (2) a descriptive vocabulary to identify structural and semantic features of chronologies, and (3) grapho-logical methods of analysis to summarize, clarify, and compare these features, the idea of a computational framework was devised that could assist researchers in identifying, annotating, and analyzing these features. Such a framework would allow for the specification of points within a chronological system to be isolated for correlation with other chronologies, as well as the visualization of these correlations and their characteristics. As noted earlier, the Leonid meteor showers demonstrate how the significance of an event is valued differently within a Winter Count that focused on one event per yearly cycle by contrast with its place in an astronomical calendar in which this was one among many celestial events, though it also repeated about every thirty-three years. A computational framework could support the specification of the structural organization and value-producing apparatus of these chronological representations — one at a time, or comparatively.
To demonstrate how this computational system might operate in practice, we designed mock-ups of a Time Capsule software environment, which demonstrates practical applications of the various contributions just outlined. It is imagined as a digital sandbox that supports various activities: grapho-logical analysis (or modeling of logical relationships expressed by graphics), semantic topic modeling of linguistic data extracted automatically (or manually) from the chronologies, a formal analysis of values generated within the ontological structure of the chronologies, and, a workspace for research and pedagogy. In the Time Capsule, existing chronologies are displayed and their structural as well as semantic features analyzed in a combination of automated and hand-annotated practice.
The Time Capsule is not a working software prototype, but a sketch for how considerations developed through the Heterochronologies project can be implemented in a computational architecture. Developing the Time Capsule enabled us to identify a set of minimum functionalities and techniques that would support this task:
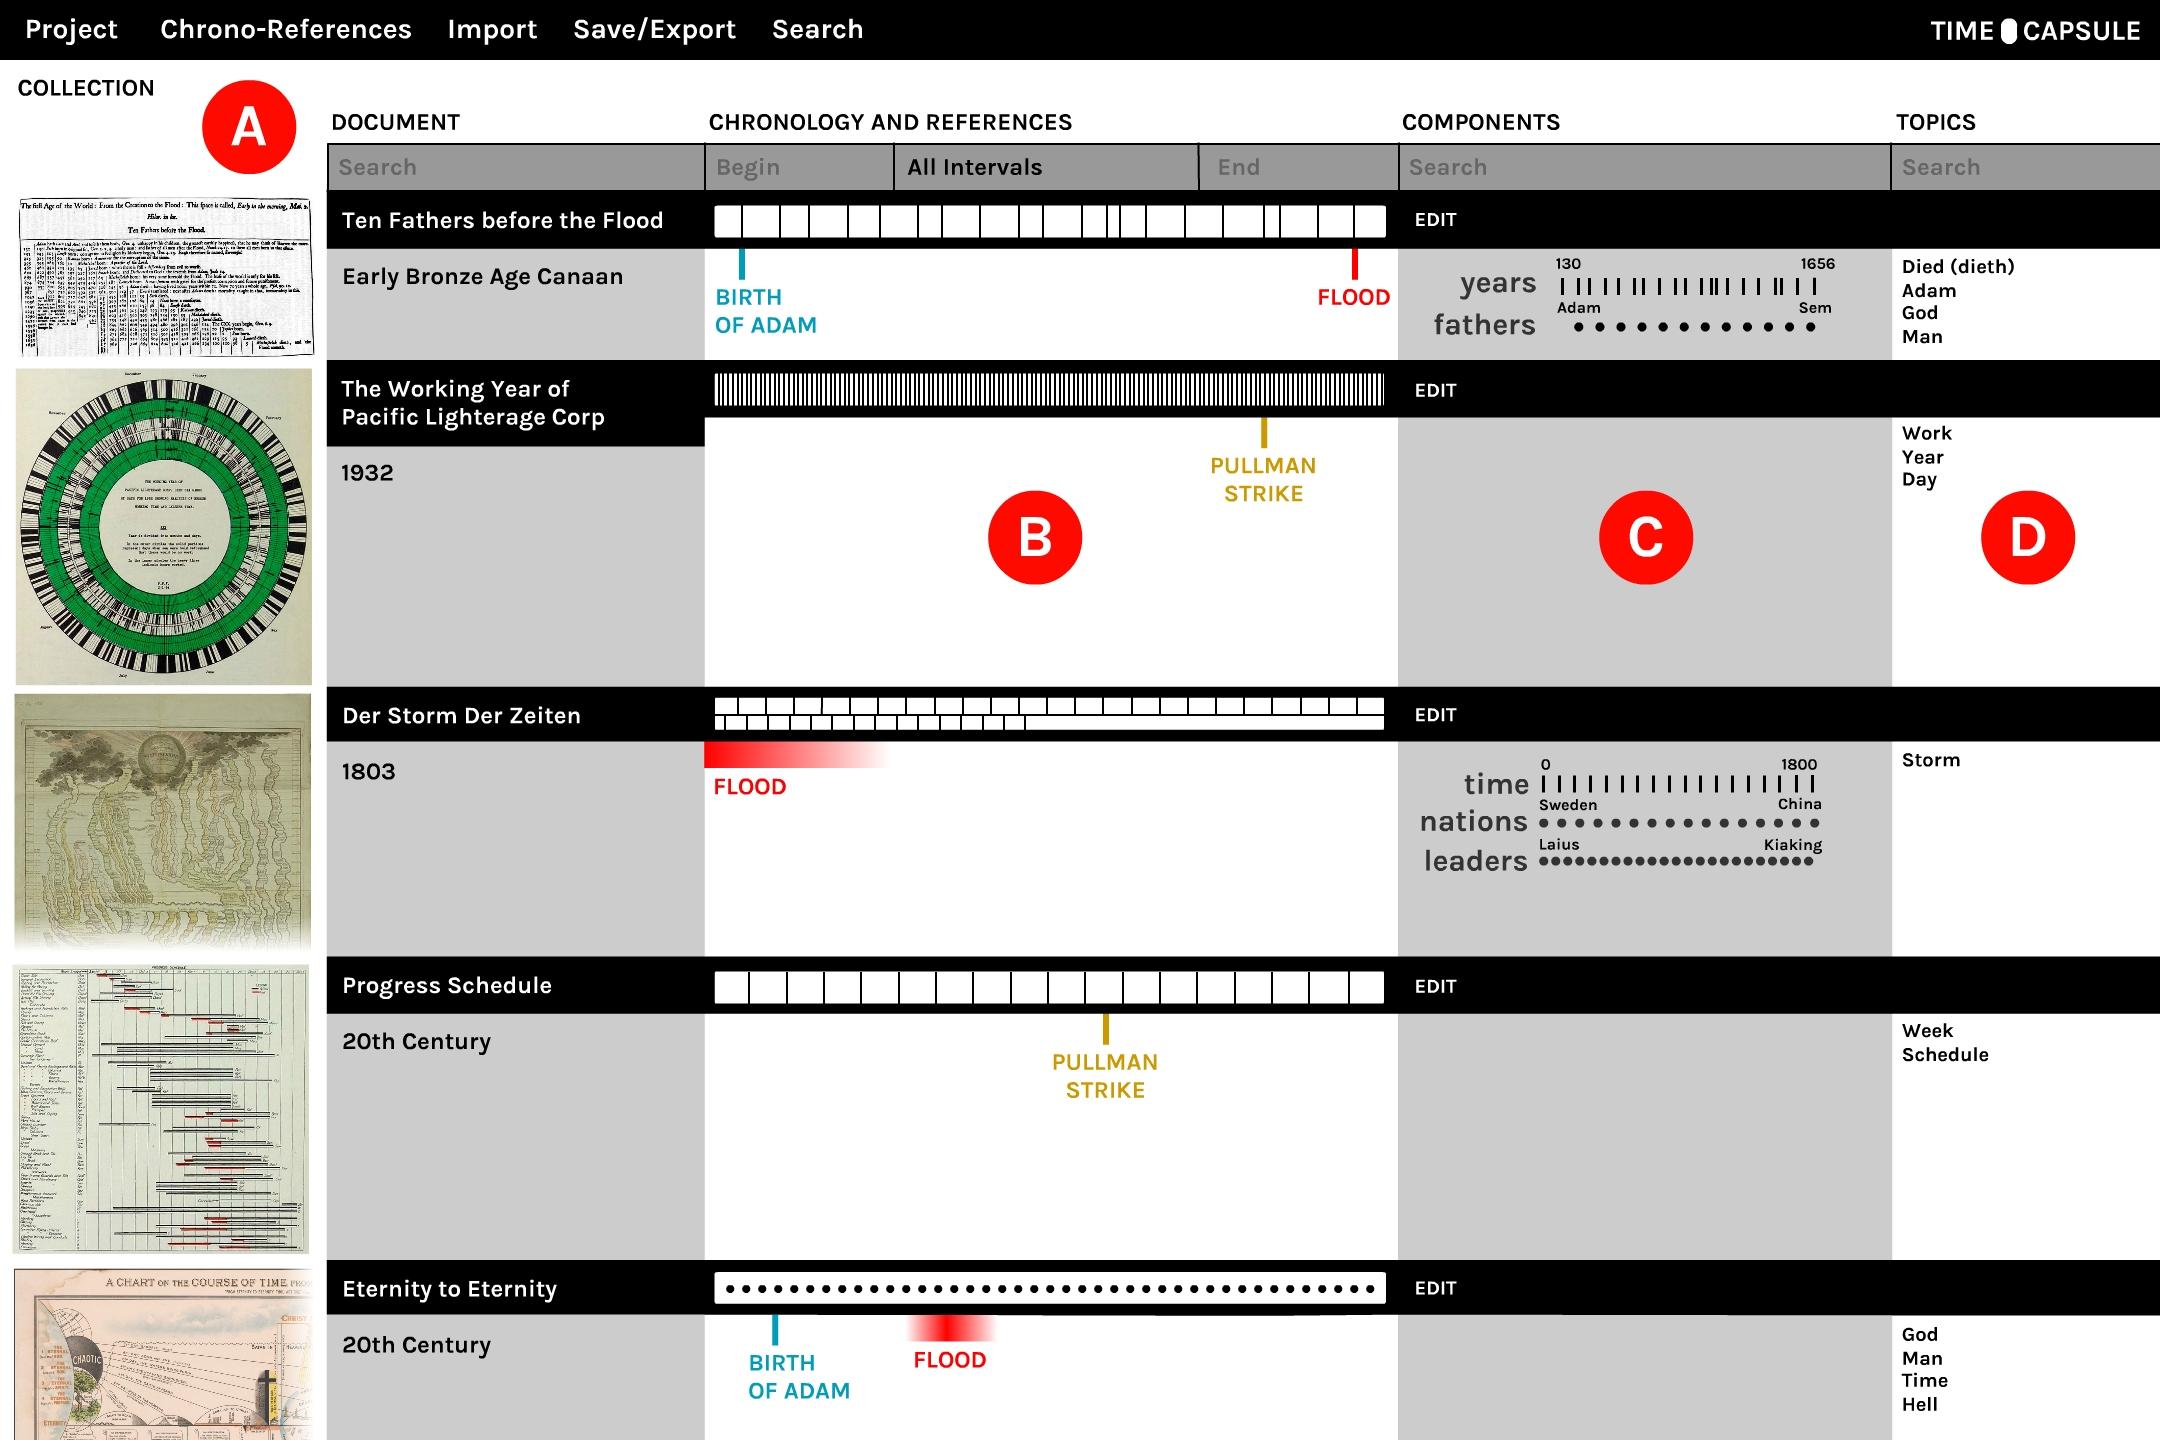
  • The user can import chronological representations as images and view them in a Collection with associated metadata and information (Figure 11). To support this, each imported chronological representation can be paired with information stored in a JSON format and indexed by a database, called its chronological metadata. The Time Capsule could be displayed in an interactive web-based interface that retrieves information from the chronological metadata stored either on the user’s machine, or in a remote repository, and uses HTML, CSS, canvas, and JavaScript to render interactive representations of the chronological metadata to the screen.
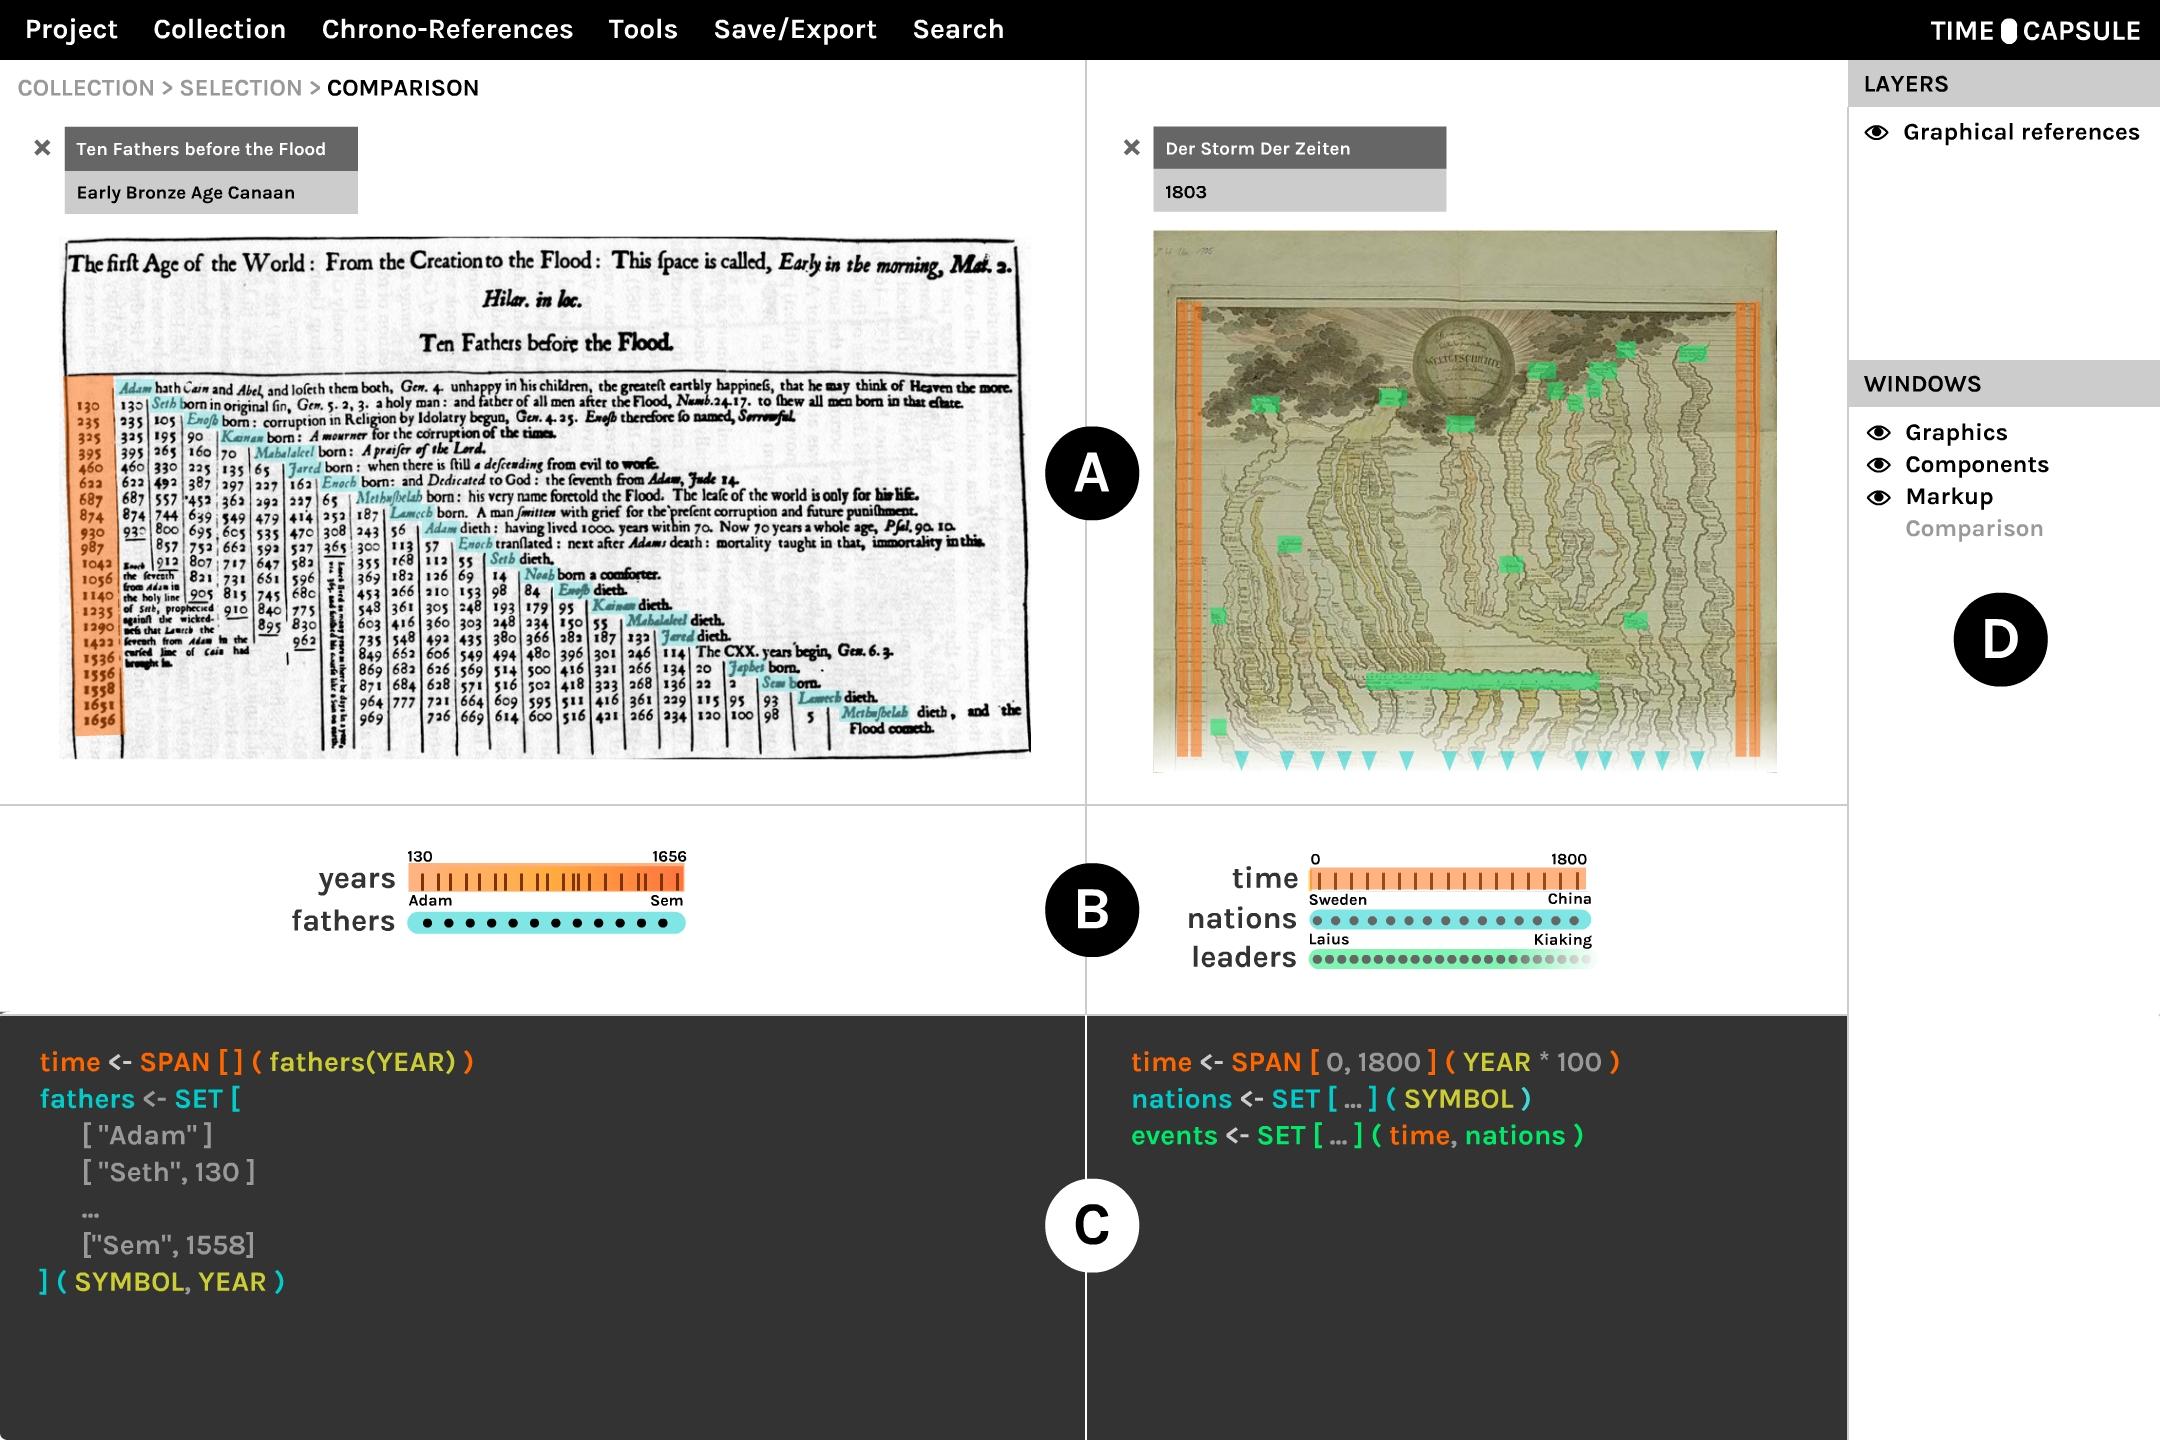
  • The user can select one or multiple chronological representations for annotation and analysis (Figure 9).
  • The user can manually annotate regions of the chronological representations in order to interactively specify their structural and semantic features, which will update its chronological metadata (Figure 9A). The X and Y position of each user annotation, along with the type of structural feature that it represents (i.e., defined by the descriptive vocabulary) is stored in the chronological metadata.
  • Optionally, the user can use optical character recognition (OCR) to automatically annotate regions of the chronological representation that might be of interest for further analysis. Once recognized, text associated with automatically annotated regions is stored in the chronological metadata.
  • A summary of the chronological metadata is displayed both graphically (Figure 9B) and in the format of a markup language that the user can edit in a dynamic text field (Figure 9C).
  • The user can manually specify the structural features of chronological representations using a markup language, which summarizes the chronological metadata and makes it editable in a dynamic text field (Figure 9C). The markup in the dynamic text field is color-coded to correspond to particular structural features that have been identified, which are also visible as graphical annotations (Figure 9A) and a visual summary (Figure 9B).
  • When the user modifies the markup in the dynamic text field, they are subsequently prompted to annotate the chronological representation to specify the graphical features that the markup corresponds to. The user can click elements of the markup in the dynamic text field to change their corresponding references. Each of these changes is stored in the chronological metadata.
  • The user can toggle the visibility of windows and features in the software environment to suit the task at hand (Figure 9D). The modularity of windows supports the extension of functionalities in the software environment with plug-ins.
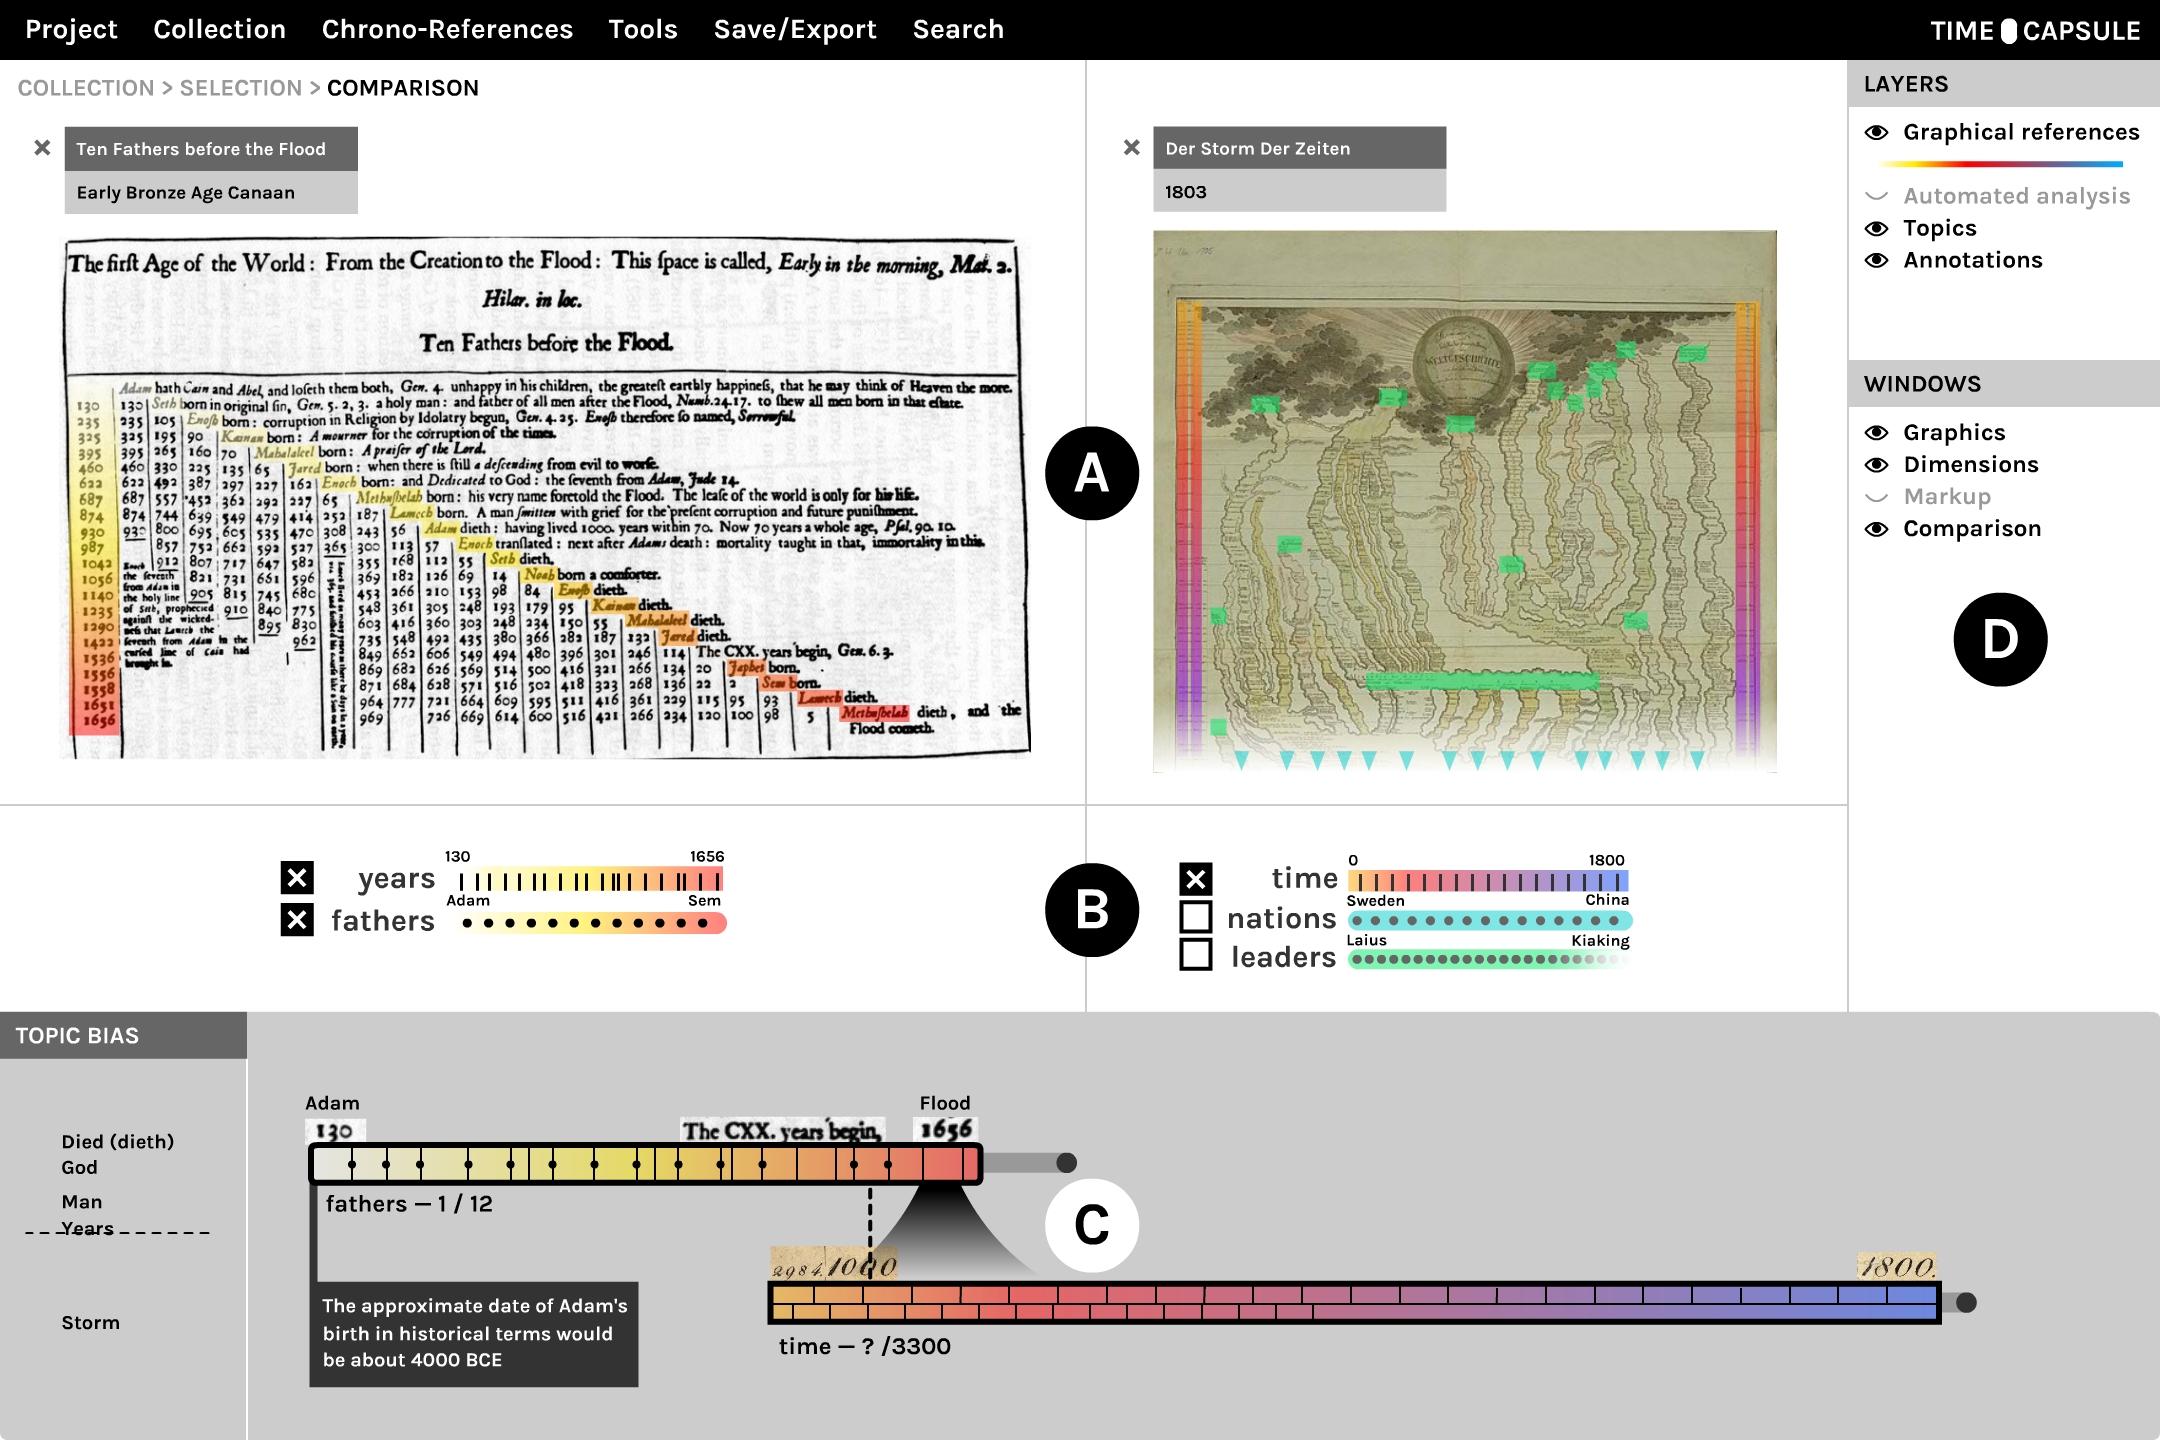
  • The user can specify temporal and chronological attributes of the structural features that they have already specified (Figure 10). Color-coding reflects relationships between temporalities and chronologies across their representations.
  • The user can select which structural features have chronological properties (Figure 10B) for visualization as timelines (Figure 10C).
  • The user can annotate visualized timelines with text (Figure 10C). Annotations are stored in the chronological metadata.
  • Optionally, the user can use optical character recognition (OCR) and subsequent topic modeling to identify the prevalence of certain terms across chronological representations, and view the relationships of these terms to each chronology (left-hand side of Figure 10C).
  • User annotations that have automatically been stored in the chronological metadata are summarized in the Collection browser (Figure 11).
In addition to access to the Collection of graphical examples (the original problem set and any additional images), the Time Capsule would be pre-loaded with a set of default “Chrono-Referencing” schemes. The Chrono-References are formal data schemes drawn from an inventory of solar calendars, lunar-solar, lunar, seasonal, and other systems (e.g., dynastic histories, geological and archaeological time scales). The workspace exemplified by the Time Capsule is designed to allow for pedagogical engagement, to ask and answer such questions as: what can be learned from comparing seasonal cycles to cosmological ones? Lunar calendars to solar? Or biblical chronological schemes to archaeological ones? And so on. Individual timelines and chronologies — of historical events or personal histories — would be able to be mapped into the frameworks through the annotation tools, thus providing a work environment for individual and collaborative work. For research purposes, the platform would allow data to be uploaded from time-keeping or time-stamped activities and displayed in relation to any of the graphical instances or on a blank template with Chrono-Referencing schemes called into play.[4] (Figures 9, 10, 11).
screenshots of the project website and code
Figure 9. 
Using the Time Capsule to specify the grapho-logical components of two chronologies: "Ten Fathers before the Flood" and "Der Storm Der Zeiten." The user has specified and named five components that appear in the chronologies: years, fathers, time, nations, and leaders, and they have defined their specific properties. The Time Capsule displays (A) the location of these components in the graphics, (B) a visual summary of the components, their properties, and their structural relationships, and (C) a dynamic text field for editing the properties and structural relationships of the components. The visibility of these displays can be toggled in the sidebar (D).
screenshot of the project website with a timeline at the
							bottom
Figure 10. 
Using the Time Capsule to compare chronologies, after having specified grapho-logical components in Figure 9. In the visual summary of components (B), the user has selected the components years, fathers, and time, which causes them to appear in the Comparison window alongside user-created annotations (C). The Comparison window visualizes and aligns the two components according to properties and Chrono-References that the user has specified. This automatic alignment colors the components with a rainbow gradient to indicate the relative progression of time. On the lefthand side of (C), the Comparison window displays a number of topics that a topic modeling algorithm has associated with the two components. The visibility of these displays can be toggled in the sidebar (D).
screenshot of the time capsule
Figure 11. 
Browsing the Collection of the Time Capsule, which lists chronologies in a scrollable table. Text fields at the top of each column (A) enable the user to search and filter the chronologies. The rows of the table display (B) timelines from each chronology annotated with Chrono-References, (C) components specified the user, and (D) topics associated to each chronology by the topic modeling algorithm.

Observations and future developments

The practical application of ideas to the Time Capsule is meant to connect the analytical engagement with research and pedagogical activity. The design of the Time Capsule includes recognition of a basic epistemological concern with constitutive difference. Such difference stems from the structural, logical, semantic, and rhetorical features of these representation (intrinsic difference). In order to conduct a meaningful comparison, differences among representations may be identified (extrinsic difference). Intrinsically non-Boolean relations represented in some chronologies (those that cannot be adequately expressed in explicit, formal terms) also need to be respected within the formalization process. Regardless of whether the compared chronologies include non-Boolean terms or not, comparisons are hosted in a probabilistic environment and represented accordingly, as floating correlations.
Other issues remain, of course, and a working prototype would expose any number of problems with the conceptual prototype. Some are theoretical, or epistemological, such as the method for representing infinity in a data structure, or for representing simultaneity or synchronicity. These are philosophical issues as much as technical ones. A practical matter is how to segment the chronologies, and what the justification for segmentation might be in any instance. The semantics of segmentation invoke the description of units of time, mentioned above (days, lifetimes, solar cycles, and other temporal units) with their symbolic as well as metrical value. Unresolved issues worth mentioning here are related to the challenges posed by the visual motifs of graphical representations which play an important rhetorical role but are not part of the formal temporal notation system; these qualities of inflection and style in lettering, drawing, line treatment, iconography, mythical figures, and allegorical images which, while incidental to the logical structure, are crucial to the semantic value, could not be readily absorbed into a logical structure.
Indeed, a thorough analysis of chronologies ought to consider structural, logical, semantic, and graphical elements. The structural elements include the value of formal position, graphical zones that map onto visual zones for machine learning, framing or boundary delimitation, components seen relationally down to the item level, and various syntaxes of part to whole of specific features. Initially, these were subjected to an automated image analysis process, akin to OCR, that pointed at graphical entities. This identified various semantic features, including components that lend themselves to topic modeling, statistical analysis, and to humanistic interpretative study within the ideological, material, and cultural contexts of which they are an expression and in which they are embedded. The graphical qualities thus gave rise to a combined typology of schematic forms, understood diagrammatically as images that perform work, obtain value through their structure (e.g., the rooted tree and the un-rooted tree; the matrix/grid and the cycle), and are available to a combination of automated and human analysis. The extent to which the analysis of graphical form can be fully automated remains to be seen, as naturally many features that give the chronologies their visual and cultural specificity will not lend themselves to computational analysis without reduction to a point that renders the information descriptively inadequate.

Conclusion

The goals of the Heterochronologies system have been to analyze visual representations of time — chronologies and timelines — as meaningful cultural and historical objects in a way that preserves their specificity. Chronologies perform semantic and syntactic work of embodying historically and culturally specific understandings of the boundaries and values of temporal events. To analyze chronology with this in mind, a method of graphical analysis of frames, axes, components, and features was developed along with an elaboration of a semantics of time units (days, lifetimes, periods etc.). The use of graphical methods of schematic logical analysis was part of this work, demonstrating the value of visual approaches as an intellectual component of research and study. The need for a computational framework to support interactive analysis of chronologies arose from the use of these graphical methods to establish parameters on which value at any particular point could be assessed through correlation, rather than through a crosswalk into a reductively uniform system. Finally, the project worked to develop a design prototype for a Time Capsule work environment that allows graphical correlation, annotation, and visual comparison for pedagogical and research purposes.
While implementation and working proof of concept remain to be realized, the conceptual development of the Heterochronologies project is an experiment in approaching problems of knowledge representation through graphical objects and visual methods. This is an opening to innovative work in digital scholarship. Chronologies are graphical, pictorial representations of data over time. They express semantic value within a defined frame, both through the use of structural and logical data representation techniques, as well as iconography. Contrastingly, the re-mediation of those artifacts under the graphical scheme we created extracts value from the pictorial and transposes it to a higher, conceptual, diagrammatic level. By abstractly describing the structures that compose and instantiate the artifacts, the diagrammatic display enables the relations that define the semantic values to come to the fore, and the entities involved in those relations to be thusly described relationally.
While such a system of representation is built upon an identification and formal description of the artifacts through a vocabulary of components, it is not hegemonic in that it intentionally concentrates on constitutive difference rather than translation. The project systematically and deliberately avoided establishing a single overarching temporal frame to which all other chronologies would be referenced. The inventory of Chrono-Referencing schemes supports correlation and comparison, so that chronologies do not have to be subsumed into a unified or single standard. While this project remains in prototype and proof of concept phase, considerable analytic work and design has been accomplished with regard to fundamental principles of graphical methods of analysis, chronologies as a specific case for comparative ontologies, and the idea of a computational framework that supports interactions in a software environment for research and pedagogy. This work is exemplified by the Time Capsule, which demonstrates the design of an extensible Library and set of Chrono-Referencing tools. The concepts being proved here are currently being developed as working prototypes.

Appendix

Solar calendars Lunisolar calendars Lunar calendars Seasonal calendars Other
Gregorian calendar
Islamic (solar Hijri) calendar
Runic calendar
Julian calendar
Tamil calendar
Buddhist calendar (set)
Hebrew Calendar
Hindu Calendar (set)
Babylonian calendar
Islamic (lunar Hijri) calendar
Nisga’a calendar
Inuit calendar
Indigenous Australian calendar
Indigenous Australian Weather calendar
Geologic time scale
Egyptian dynasties
Egyptian Periods
Egyptian lunar calendar
Chinese Dynasties;
Maya calendar: Haab’, Tzolk’in, Trecena
Aztec calendar: Xiuhpohualli, Tonalpohualli
Table 1. 
A Sampling of Chrono-Referencing Schemes

Notes

[1]  A further analysis of the relation between frame and elements informed by formal logic and analytic philosophy traditions reveals how the frame ultimately models the reality in which elements exist. Specifically, as it pertains to the environment it circumscribes, the frame is responsible for answering the question “what is,” in that it identifies the entities that exist within itself and thereby grants them ontological status. However, it also defines the nature of those entities by characterizing and modelling the semantic relations in which they are involved and consequently the rules that dictate their participation in those relations; by defining the essence and quality of elements, rules and relations, it establishes the metaphysics of the graphical representation. The conjunction of ontological and metaphysical definitions results in the emergence of the epistemological paradigm (and constraints) the representation expresses.
[2]  We examined Period.o and OWLTime as possibilities, but the first has a strong geo-location structure and the second is premised on an a priori positivist dating system. Neither of these worked for our premise of chronologies as descriptive structures instantiated in graphical form.
[3]  Credit for making a typology of units of time belongs to Helge Jordheim, in conversation about the project.
[4]  The format of this Time Capsule space is inspired by the Map Room project of Yanni Loukissas and others, which encourages participatory engagement with cartographic base maps in the same way that the Heterochronologies supports play with the chronological schemes.

Works Cited

Drucker 2009  Drucker, J. SpecLab: Digital Aesthetics and Projects in Speculative Computing. University of Chicago Press (2009).
Drucker 2014  Drucker, J. Graphesis: Visual Forms of Knowledge Production. Harvard University Press (2014).
Friendly 2008  Friendly, M. “A Brief History of Data Visualization.” In C. Chen, W. Härdle, & A. Unwin (Eds.), Handbook of Data Visualization (pp. 15–56). Springer (2008). https://doi.org/10.1007/978-3-540-33037-0_2
Rosenberg 2010  Rosenberg, D., & Grafton, A. Cartographies of Time. Princeton Architectural Press (2010).
Tufte 1997  Tufte, E. R. Visual Explanations: Images and Quantities, Evidence and Narrative. Graphics Press (1997).
2022 16.3  |  XMLPDFPrint