


DHQ: Digital Humanities Quarterly
2020
Volume 14 Number 2
Volume 14 Number 2
Reading Chicago Reading: Quantitative Analysis of a Repeating Literary Program
Abstract
This essay presents quantitative capture and predictive modeling for one of the largest and longest running mass reading programs of the past two decades: “One Book One Chicago” (OBOC) sponsored by the Chicago Public Library (CPL). The Reading Chicago Reading project uses data associated with OBOC as a probe into city-scale library usage and, by extension, as a window onto contemporary reading behavior. The first half of the essay explains why CPL’s OBOC program is conducive for modeling purposes, and the second half documents the creation of our models, their underlying data, and the results.
Introduction
In The Library Beyond the Book, Jeffrey T. Schnapp
and Matthew Battles note the variety of data generated in contemporary libraries
this way: “Every time a book is taken off the shelf, a file
is downloaded, or a computer workstation is booted up, a story is told, and
cataloged, and filed away in a database. In this way, each act of reading in
the library broadcasts a handful of seeds, from which new growths of data
will either spring — or disappear into a forest of statistical noise”
[Schnapp and Battles 2014, 126]. Schnapp and Battles highlight how public
libraries, like many institutions, are data-rich but information-poor; they
remind us that much of the content in library databases is left fallow from lack
of tools or budget or both; in turn, they challenge us to imagine new
architectures and algorithms for libraries when, in the age of search, we find
both literally and figuratively that “there is no
shelf”
[Shirky 2005].[1]
What follows is a report on one attempt to describe, and remedy, some aspects of
this condition. This essay is about one of the largest and longest running mass
reading programs of the past two decades, “One Book One
Chicago” (OBOC), sponsored by the 80-branch Chicago Public Library
(CPL) system since the fall of 2001. Our project works with anonymized CPL
circulation data from this program and data of several other types to ask with
tools of data science, can we capture and model some of the salient
relationships of texts, readers, and their environment, particularly when a city
assigns itself mass-mediated public interactions with literary works? The
Chicago Public Library’s goals with OBOC are civic as well as cultural, and
capturing the effects of the program at metropolitan scale might even show how
DH tools and methods might inform social policy. “Can cities
save the world?” political scientist Benjamin R. Barber asked (and
answered affirmatively) in his 2013 study of city-scale planning experiments,
If Mayors Ruled the World. Because of their
more manageable scale and integrated governance structures, Barber argues that
in both developed and developing nations cities have become “democracy's best hope”
[Barber 2013, 3]. OBOC is a complex city-scale cultural
phenomenon and study of it offers a means of capturing and quantifying how
broad-spectrum civic programs have differential impact upon a heterogeneous
population.
A major goal of the Reading Chicago Reading project (RCR) is to create open
source tools so that public librarians and digital humanists can experiment with
the kinds of predictive insight presently being generated by proprietary
software in the film and music industries and for mass market book sales [Hit Song Science]
[Archer and Jockers 2016]
[Alharthi et al. 2018]
[Piper and Portelance 2016]
[Alter and Russell 2016].[2] We have created the first instance of
such a predictive model, and in what follows we will report about how it works.
We also discuss findings and limitations of our data and methods to date. The
first half of the essay explains why CPL’s OBOC program is notable in itself and
conducive for modeling purposes, and the second half documents creation of our
models, their underlying data, and the results. To anticipate a bit, we chose
Chicago Public Library’s “One Book One Chicago”
program because its prior seasons constitute useful training data and its
current and future programs (i.e. different book selections) provide new data
for the model which can be tested for the same areas in the same city. Our model
predicts the annual circulation of a chosen book for every CPL branch; it is, as
far as we know, the first attempt to combine tools of literary sociology and
data science for city-scale prediction of this kind. Matthew Jockers noted with
regret just a few years ago that “[t]he conclusions we reach
as literary scholars are rarely ‘testable’ in the way that scientific
conclusions are testable. And the conclusions we reach as literary scholars
are rarely ‘repeatable’ in the way that scientific experiments are
repeatable”
[Jockers 2013, 6]. But the Reading Chicago Reading project
captures the repeating traces of literary readership across a city by means of
public library data and several other forms of information. In this way, our
project offers an opportunity to formulate repeatable, testable, hypotheses
about real-world reading culture at city-scale.
The Reading Chicago Reading project is also creating a growing archive about a
notable large-scale program of elective reading and related social media,
reminding us at the same time of the importance of documenting internet-mediated
cultural programs. The stakes are high: if born-digital and mixed digital/analog
phenomena such as the “One Book One Chicago” program
are not captured in a timely manner they are likely to pass beyond any practical
means of recovery by future researchers. Since reconstruction of
internet-mediated culture requires hardware and software beyond the means of all
but the most attentive and well-resourced archivers, “[t]he
first few decades of the online revolution are already set to be a dark ages
of sorts”
[Weber 2016, 55]. This essay is one of several forthcoming
from project researchers and presents initial results of our practice of
combining multiple forms of investigation — time-series analysis, social media
analytics, location extraction from texts and maps, sentiment analysis, and text
measures — to analyze an ongoing program in one of the United States’ largest
public library systems. While “One Book One Chicago”
forms an opportune starting point, we expect that our models and techniques can
be applied to library holdings generally.[3]
And finally, as a pioneering “city of big data”, Chicago offers particular
advantages for the study of mass-mediated uptake of cultural forms. A rich
history of quantitative sociological work on its highly-stratified urban fabric
has long made Chicago “an excellent laboratory for testing
theoretically-derived hypotheses”
[Sampson 2012, viii].[4] Our study of some CPL book checkout data
is, admittedly, small by the standards of Robert J. Sampson’s Project on Human
Development in Chicago Neighborhoods (PHCDN), but it is informed by a similar
desire to understand how individual actions and perceptions are embedded in
“neighborhood effects” that structure people’s
understanding of their place and possibilities in the city and the world [Sampson 2012].
Research questions
The “Reading Chicago Reading” project is animated by a
number of research questions:
- When a large public library system “sponsors” a city-wide collective reading event — and makes the book selection part of a larger ensemble of multimedia programming — what can we learn about the different processes that shape cultural perception across a metropolitan region?
- How does one live in a city differently after reading about that same city, and perhaps in association with others? Cultural programming often serves as a form of imagined community, and we can use network effects to understand these communities in the city.
- What are the measurable effects of sponsored book culture where spillover effects of library programming (neighborhood to neighborhood, branch to branch, and online) may be identified? Because in addition to reading and group discussion, Chicago’s “One Book” programming has also featured, for example, guided city tours, “maker” events, film screenings, dances, and community gardening, novel forms of belonging and citizenship are presumably created by means of recommended reading.
- And importantly, how does the above vary by neighborhood, and library branch, in a city so identified by neighborhoods?
While we cannot in a single paper answer all of these questions, given our
circulation data from CPL, census and other publicly-accessible city-wide data
(demographics in this study, but police reports, shared bike usage, FOIA
requests, and the like are also possible), social media data (gathered via API),
and quantitative measures from selected books, it is possible by bundling them
to document changes in Chicago’s attention economy, and we will do so in part in
what follows. Our project’s aim is to capture and, to a degree quantify, how
Chicago’s public script about itself changed during year-long library
programming around books on the theme of, for example, “Music: The Beat of the
City” (the 2017-18 OBOC season) or “Food” (the 2016-17 season). Can
the cultural pulse of a large city be captured quantitatively and modeled by way
of public library circulation data? Our project proceeds from the premise that
it can.
Project description
The “Reading Chicago Reading” project began in
discussions about the possibility of capturing and predicting library-sponsored
readership across Chicago by means of the OBOC program. It was apparent to the
project’s founders that the program resembled a repeating and repeatable
experiment – that is, each chosen OBOC book season represented a data probe into
library usage and, by extension, a window onto the elective reading behavior of
the patrons of a major American library system. The project’s motivating
hypothesis was that book checkouts per branch, combined with library branch
demographics, promotional activities, and chosen text characteristics would
constitute variables that could be used to predict patron response to future
OBOC books, and one of our key tasks has been to encode these variables into a
predictive model and use the modeling process to discover relationships between
them. A “one book” program is a repeating mixture of personal and
collective experience with some slow-changing variables (e.g. number of library
branches and general neighborhood demographics) as well as periodically-changing
input such as text features of the annual book selection (e.g. reading
difficulty and total word count) and publicity around the book, all of which
drives patron interest and potentially library branch checkout numbers.
The “One Book One Chicago” (OBOC) program is also a
useful optic for observing how readers engage with texts in different ways
across quite variegated social space. Reading of course happens in a number of
modes, from silent reading of printed books in armchairs (a diminishing
practice, we suspect) to partially-solitary reading via electronic devices on
public transit or in coffee shops, to fully public reading and associated
“engagement” via blogging, posting on Goodreads and Amazon, and
participation in book clubs. People who read also like to talk about what and
how and why they read; they document books both good and bad, next choices,
reflections, recommendations, and the like.[5] And
heterogeneous social spaces bleed over into complex media spaces. For example,
uptake of narrative through audio rather than sight is a rapidly growing
phenomenon, and the explosion of transmedia fanfiction and other forms of
“post-press” literature extend the reading and writing process ever
farther.[6]
“Texts,” Matthew Kirschenbaum notes, “are increasingly networks of transmedia properties. … [T]he
bigger the book, the more extended its network of transmedia relations
becomes”
[Kirschenbaum 2010].[7] As reading
interfaces continue their shift from documents to performances (as Lev Manovich
has nicely summarized it), those of us who seek to understand reading in the
present and future will benefit from the tools of data science [Manovich 2013, 33–9]. Social media platforms in particular
facilitate new kinds of capture and visualization of cultural phenomena at the
scale of the city, and we have been inspired by many exciting projects and
studies.[8]
“The Book is Just the Beginning”
Community-based mass reading events like “One Book One
Chicago” have exploded in popularity around the United States so
quickly that we ought to take a moment to grasp the implications of the
mainstreaming of such programs. Book clubs have existed for decades, of course,
with roots in the United States reaching back to the first circulating libraries
and to public lecture circuits. [9] The
contemporary mass-mediated book club, however, marked its public success with
Oprah Winfrey’s TV “Book Club” which began in the
fall of 1996 and ran for fifteen years.[10] Book club culture has been the subject of many studies, each
noting the different forms of intellectual and social bonds created, and
sometimes challenged, when people meet to talk about fiction and nonfiction with
others like and unlike themselves.[11]
Study of a large contemporary metropolitan “one book” program is useful
given growing attention to the scope and effects of social media filter bubbles
from micro-targeted advertising and ad-supported news [Pariser 2011]
[Helmond 2013]
[Tufekci 2017]
[Singer and Brooking 2018]
[Mina 2019].[12] In asking residents to read and
discuss a literary work as a public, a book program seeks to create a virtual,
temporary, community for mass, but not similar, responses among people who might
not otherwise become entangled together in real (or virtual) life. Many CPL
patrons might read Saul Bellow’s Adventures of Augie
March (fall 2011 OBOC season) or Jane Austen’s Pride and Prejudice (spring 2005 OBOC season); perhaps a notable
fraction of the city’s population will take up the selected work in some manner
over the city’s season. But the result of this programming is not, and indeed
cannot be, the diffusion of a single opinion or the creation of consensus as if
participants were linked by a newsfeed or social media account pointed to the
same content. A city-scale book club, this is to say, fosters a different brand
of imagined community: a sponsored, and collective, experience moving together
in shared time but in the service not of homogeneity of intellectual outcome but
rather an improvisatory and unpredictable detachment from parochialism. In this
way, the community fostered by a library system’s one book program both
preserves, and departs from, what Anderson described as the normative uses of
print capitalism [Anderson 1991].
Mass reading events like OBOC are also one more component of a broad trend since
the early 1990s in which civic leaders commission iconic buildings, programs,
and public artworks to signal status as a “global city” to local residents
and to the world.[13] Community book clubs are open-ended
in format and have ranged from print-only to all-digital; to date, they have
focused largely on literary fiction and nonfiction, but there are other possible
reading assignments that might not even be reading in a traditional sense —
witness “Open Data Book Clubs” in Canada, for
example, for which city data sets are assigned monthly; still other kinds of
collective library experience are indeed possible.[14] Perhaps not surprisingly,
literary fiction has formed the bulk of reading selections for programs such as
OBOC. Literary fiction was the standard against which other forms of reading was
measured in several NEA studies since the early 2000s [NEA 2004]
[NEA 2007]
[NEA 2009]
[NEA 2017]. A much-cited 2013 article in Science found that literary fiction, with its requirement of
attentive engagement with subjective states, unpredictable events, and complex
characters, revealed statistically significant benefits in measures of “theory of mind” (ToM), arguing that because “readers take an active writerly role to form representations
of characters’ subjective states, literary fiction recruits ToM”
[Kidd and Costano 2013, 380]. In addition, literary fiction requires
readers “to expand our knowledge of others’ lives, helping
us recognize our similarity to them”
[Kidd and Costano 2013, 380].[15]
The predominance of literary fiction in One Book One Community programs around
the U.S. bears this out. Helpfully, the Library of Congress has documented
hundreds of programs and their book choices across the U.S. as part of its
“Big Read” initiative. While the data is
incomplete in at least one major case (stopping at the 2007 season for Chicago’s
OBOC, for example), it lists over 2000 community programs and just over 860 book
choices stretching from Seattle in 1998 to Santa Monica in 2016. The most
popular book choices include predictable popular titles such as To Kill a Mockingbird (90 times), Bradbury’s Fahrenheit 451 (50 times), Hosseini’s The Kite Runner (48 times), and Homer Hickam’s Rocket Boys (38 times). A second tier of popular
choices includes canonical classics such as Moby
Dick, Pride and Prejudice, A Doll’s House, A Long Day’s
Journey into Night, and Frankenstein,
but also a great deal of middlebrow fiction and nonfiction by the likes of
Barbara Kingsolver, Mitch Albom, Mark Haddon, Eric Schlosser, and Barbara
Ehrenreich. There is a marked presence of genre fiction, particularly science
fiction and thrillers; some unexpected choices might include Loudon County
Virginia’s selection of Nikki Giovanni’s poetry (2010), Richard Dawkin’s The Selfish Gene (by Kansas City, MO in 2008), and
Hannah Crafts’ The Bondwoman’s Narrative
(Indianapolis in 2004).[16]
We should also note, however, that the forms of difference readers may encounter
in the OBOC’s selected books’ represented worlds — social, ethnic, racial,
sexual, and the like — do not of course guarantee additional or positive
encounters with such difference in life. Chicago is a highly segregated city, as
it has been for generations, and this is reflected in the hard facts of
branch-area demography around the city. We are also aware of the notable fact,
quantified in Robert J. Sampson’s PHDCN research, that Chicago neighborhoods
with a higher density of community organizations tend to maintain that density
over time, in effect enabling residents in some parts of the city to wield
outsize influence in cultural impact (though spillover effects into contiguous
neighborhoods were also notable) [see Sampson 2012, 179-233]. And reading for pleasure has a history; it is
not a practice evenly distributed across spaces and publics. As Elizabeth Long
noted in her study of book clubs in Houston, Texas, “American popular culture marks leisure reading by both class and
gender”
[Long 2003, xvii]. In a number of important studies, Wendy
Griswold has shown how the U.S. has been fragmenting into a differentially
empowered “reading class” and other, less
print-centered, parts of the population who are, paradoxically, literate but not
readers [Griswold 2008, 68]
[Griswold et al. 2014]
[Griswold and Wohl 2015].
Why Chicago?
The origin of the city-wide “one book” program appears to be in 1998, when
librarians Nancy Pearl and Chris Higashi at the Seattle Public Library sought
ways harness the collective energy of the many small book clubs scattered around
the city. They formulated their initial program as a question — “What if all
Seattle read the same book?” — and chose Russell Banks’ The Sweet Hereafter as the object of citywide
discussion groups in libraries and private homes. Pearl and Higashi reported the
idea at a meeting of the American Library Association, and by 2002 the ALA
distributed “how to” packets for library systems willing to try the new
idea. Nan Alleman at the Chicago Public Library read a Chicago Tribune article about Seattle’s program and quickly
launched “One Book One Chicago” in the fall of 2001
with the city assigned to read together Harper Lee’s novel To Kill A Mockingbird. CPL branches stocked hundreds of additional
copies of the book and discussions were scheduled throughout the fall in
branches across the city. The Chicago Public Library received extended press
coverage that enabled the idea to scale quickly.[17]
Chicago city government was immediately committed to the program. Initiated with
fanfare by Mayor Richard M. Daley in the fall of 2001, and evolving in concert
with other major public projects like Millenium Park (completed in 2004), the
OBOC program is now a central node in cultural programming in Chicago. In the
wake of the first season, Mayor Richard M. Daley called Chicago’s public library
system a “community anchor” and the “heartbeat” of its neighborhoods [Putnam and Feldstein 2003, 38]. Daley’s comments in the program guide for
Willa Cather's My Antonia (the OBOC choice for fall
2002) announced lofty civic goals: “One Book, One Chicago
cultivates a culture of reading and discussion by bringing our diverse city
together around one great book. Reading great literature inspires us to
think about ourselves, our environment and our relationships. Talking about
great literature with friends, family and neighbors can add richness and
depth to the experience of reading.” OBOC seasons created a dramatic
impact in the city. In 2001-2, Harper Lee’s To Kill a
Mockingbird
“was checked out of branch libraries more than eight
thousand times over the course of a few months. Bookstores sold thousands
more copies — To Kill a Mockingbird was on the
Barnes & Noble top ten list for two months”
[Putnam and Feldstein 2003, 51].
The program seemed to fulfill its mission of bringing new engagement into
metropolitan cultural events in the aftermath of the 9/11/01 terrorist attacks
and the inauguration of new conversations about citizenship and cultural
difference. Taking part in a shared narrative took on new meaning and amplified
a sense of collective purpose. When asked about the “One Book” program, a
15-year-old African-American student in Chicago told interviewers “[i]t makes me feel good to be part of a city that is all
reading the same book”
[Fuller and Sedo 2013, 231]. Chicago’s program has been successful
close to twenty years now and continues, at the time of writing, with Elizabeth
Kolbert’s nonfiction book The Sixth Extinction and
a city-wide theme of “Climate Change.” One Book programs have many benefits
and few liabilities for all involved: book publishers sell more books (since not
all city residents will wait to check it out from a branch library); public
libraries receive additional foot traffic and community relevance; citizens
become active in a civic experience with cultural capital. In a publicity
statement for the 2016-17 program centered on Barbara Kingsolver’s Animal Vegetable Miracle: A Year of Food Life, Mayor
Rahm Emanuel and CPL Commissioner Brian Bannon noted that the choice was
intended as a catalyst for city-wide conversations about food, politics,
heritage, and the environment. “From October through May
2017, One Book, One Chicago will explore a central theme — ‘Eat Think
Grow’ — with citywide programming focused on cultural cuisine,
cooking, eating, sustainability and urban farming. From seed, to grocery, to
cookbook, to table — we’re discussing all the ways we relate to and
celebrate food. … Branch libraries host highlighted programs such as
culinary walking tours, urban gardening discussions, and food talks about
beer, bees, coffee and the Slow Food Chicago movement.”
As elective literary reading and related events, OBOC participation is cast as a
means toward better historical and personal insight into the lives of others.
The ideal of a program like OBOC is collective practices of learning and
world-widening through mediated discussion of that reading as well as
participation in live events. The OBOC’s annual repetition makes it resemble a
city art biennial, and its overall experience is not unlike a fusion of book
clubs, continuing ed classes, social media updates, and TED talks. People
participate in a number of ways, not all centered on reading. In fact, the CPL
slogan that “the book is just the beginning” is apt.
OBOC programming itself has changed over the past 15-plus years, shifting from
three-month programs centered on print book discussion “clubs” at physical
CPL branches to nine-month seasons for which the assigned book is just one
element, a teaser or “loss leader” as it were, for other civic initiatives,
many of them digital. Figure 1 shows just some of the dozens of events around
the city created in association with the 2018/19 OBOC book choice, Philip K.
Dick’s Do Androids Dream of Electric Sheep? and
season theme “Imagine the Future.”
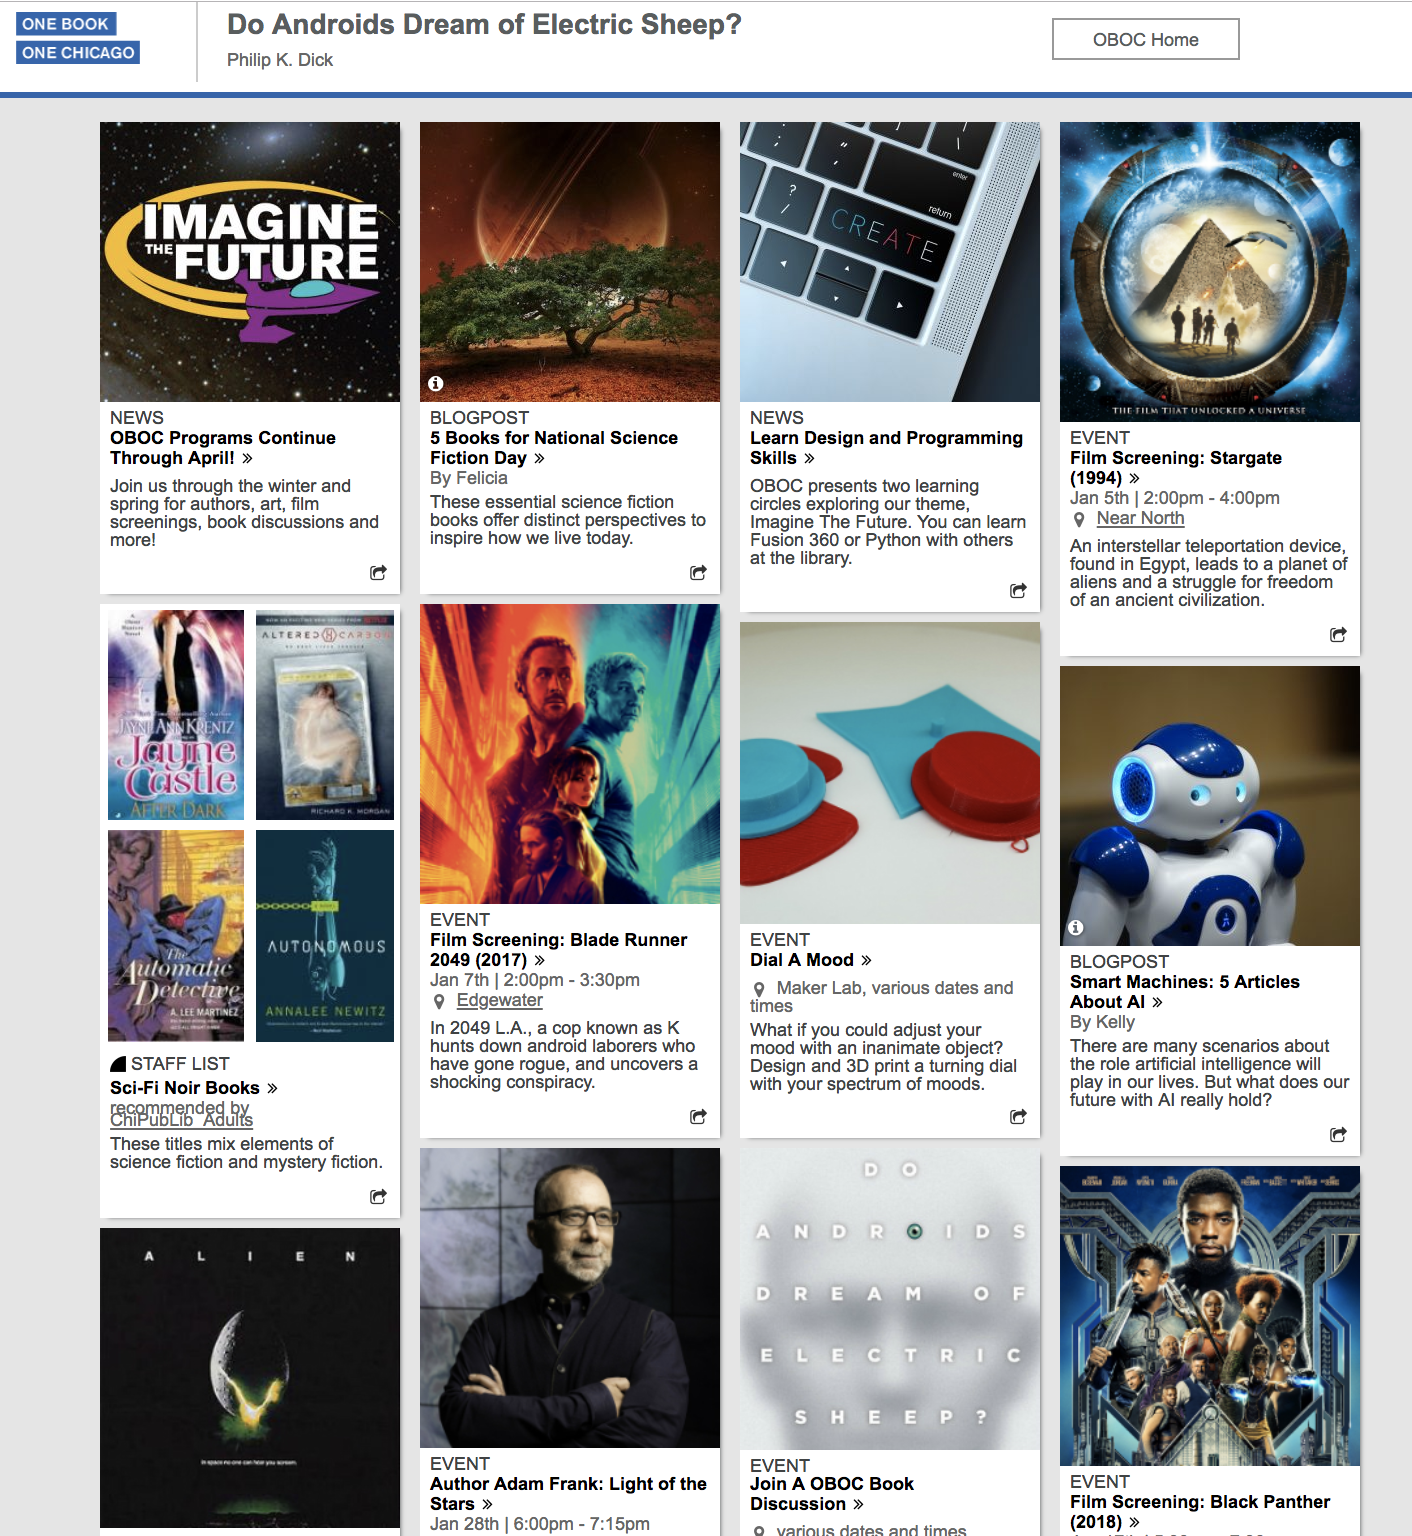
Figure 1.
Screen capture of a segment of CPL's OBOC programming. Accessed 3 Jan. 2019.The variety of activities and media shown in Figure 1 also reveals why a large
city-wide “One Book” program requires dedicated sponsors and culture
workers. In Making Literature Now, Amy
Hungerford calls for attention to the non-profit organization employees and
public library staff who plan and implement experiences with contemporary
literature. These “evangelists of culture”, as [Griswold and Wohl 2015] describe them, include Jennifer Lizak, CPL’s OBOC
director, and around her the wider set of Chicago Public Library community
outreach staff who create and facilitate programming across the city. Hungerford
writes that these “‘neglected agents’ of cultural
formation not only play a crucial role in the cultural field but also
constitute a set of actors for whom literary or artistic production matters
beyond the moment of ordinary consumption”
[Hungerford 2016, 38]. Culture brokers play a shaping role in
the formation of the imagined community of a One Book program; but their choices
of texts, as Griswold and Wohl show, tend to be based on hunches about
demographic representativity (of authors, of branch behavior, of book topics)
and reports about past book group success elsewhere. Tools of data science have
not been an option. The decision-making process to make a Chicago Public Library
OBOC selection requires several months of meetings, involves multiple parts of
the library and the city bureaucracy, and is opaque to outsiders. As might be
suspected, choice of a One Book One Chicago text is not based on generalizable
criteria of sales, text length, genre, canonicity, or publication date. As we
saw above (and see Appendix 1), CPL OBOC choices
since 2001 have been quite varied — and yet a few tendencies can be discerned in
most One Book programs nationwide: a tendency to favor living authors,
especially those able to present their work at public readings, and a tendency,
when possible, to select books with a tie to Chicago. Given the importance of
social media outreach, authors with social media savvy are particularly
appealing in the selection process.[18]
Data Sources
One of the challenges of digital humanities research is the assembly of
appropriate data sources. “Reading Chicago Reading”
combines data about people, about books, and about their interactions through a
public library system and associated social media. We bring together a diverse
set of data sources, each with its own history, complexities, and caveats. While
we can be sensitive to these nuances, algorithms by their nature cannot, and
consequently treat all data as equally valid and reflective of some real-world
quantity or property. Such limitations of our CPL data are therefore limitations
of our conclusions as well and need to be fully unpacked. We will be using the
terminology in Table 1 in this discussion and in the analysis below.
| Season | The time period between the announcement of one OBOC selection and the next. |
| Book/Text | An OBOC selection, a particular literary work. |
| Volume | A physical manifestation of a book, an item in the library’s inventory. |
| Transaction | Any action related to a volume recorded in the CPL system. |
| Circulation | Total count of “checkout” transactions of physical volumes from a given branch (or branches) over a particular period. |
Table 1.
TerminologyOBOC selections (2011-2016)
Since fall 2001, the One Book One Chicago program has selected over two dozen
books. (See the full list of titles in Appendix
1.) Roughly half are novels, but the set also includes several
short story collections (O’Brien, Lahiri, Li), two novellas (Solzhenitsyn,
Cisneros) and two plays (Hansberry, Miller). Non-fiction and historical
works, especially those with a connection to Chicago, play a notable part in
the list (Dybek, Smith, Dyja, Wilkerson, and Kot). Most of the works date
from after World War II, and just under half from the past two decades.
Several OBOC book choices reflect the multiple communities in Chicago,
White, Black, Latino, and Asian; 18 of 29 (62%) authors are male. Our data
set encompasses books from seasons running 2011 to 2016 — the years for
which we have CPL circulation data. [19] From
the fall 2011 to the 2016-17 OBOC season we have seven central, but
heterogeneous, texts: Saul Bellow’s sprawling 1953
bildungsroman (and National Book Award winner) The Adventures of Augie March; a 2010 short story
collection by Chinese-American author Yiyun Li, Gold
Boy, Emerald Girl; Markus Zusak’s popular novel set in Hitler’s
Germany, The Book Thief (2005); Isabel
Wilkerson’s The Warmth of Other Suns (2010)
about African American migration from the southern U.S. over the 20th
century; Michael Chabon’s comic epic The Amazing
Adventures of Kavalier and Clay (2000); a 2013 study of
post-World War II Chicago (The Third Coast by
Thomas Dyja), and Barbara Kingsolver’s 2007 meditation on food and ecology,
Animal Vegetable Miracle: A Year of Food
Life. Table 2 lists these books and the abbreviations that we
will use to refer to them throughout the rest of this discussion.
| Year | Title | Abbreviation |
| 2011 (Fall) | Saul Bellow, The Adventures of Augie March | AM |
| 2012 (Spring) | Yiyun Li, Gold Boy, Emerald Girl | GB |
| 2012 (Fall) | Markus Zusak, The Book Thief | BT |
| 2013 | Isabel Wilkerson, The Warmth of Other Suns | WS |
| 2014 | Michael Chabon, The Amazing Adventures of Kavalier and Clay | KC |
| 2015 | Thomas Dyja, The Third Coast | TC |
| 2016 | Barbara Kingsolver, Animal, Vegetable, Miracle | AV |
Table 2.
Seasons and selections covered by our data setDefinition of an OBOC season
As noted earlier, CPL’s management of OBOC events has evolved over its nearly
20-year history. For the purposes of our project, the biggest discontinuity
appears at the very beginning of our data set. 2012 was the last year that
two seasons were held in one calendar year (i.e. fall and spring). Gold Boy, Emerald Girl in spring 2012 followed
directly on the heels of the Augie March fall
2011 season. The Book Thief was then featured
in the fall of 2012. The next selection, The Warmth of
Other Suns, was launched one full year later in the fall of 2013
as CPL moved to a one-book-per-year schedule. In this case, at least, we
were presented with a problem of how to define an OBOC “season.” Our data
showed, for example, that the fall 2011 selection Augie
March was still being checked out at a significantly higher rate
at many branches more than one year after its selection compared to the
months prior to its announcement as an OBOC selection — and all despite the
fact that another OBOC season and book had been launched in the meantime.
This finding suggested that a 12-month span was a reasonable choice for a
season length, even for the books chosen bi-annually. We therefore use
library transaction data over the 12 months following a book’s selection. As
a baseline for the circulation of a book prior to its OBOC selection, we use
the six months of city-wide transactions prior to the book's launch. The
reason for this choice is again contingent on circumstances beyond our
control: due to CPL’s data migration in mid-2011, we only have data for six
months prior to the launch of Augie March. For
consistency, we define prior circulation for all the books in the same
manner.
The next question is how to define the season duration for each book. For
almost all seasons, the identity of the book remained secret until a defined
“launch” day, where a public announcement would be made by the
Chicago Public Library and (sometimes) the Mayor’s office. However, the
identity of the fall 2012 selection, The Book
Thief, was leaked in newspaper reporting and then subsequently
confirmed by the Chicago Public Library in the spring of that year, making
the choice known for many months prior to the official launch. In this case,
we were confronted with a number of choices, none entirely satisfactory.
The Book Thief data could have been
discarded. However, we were reluctant to do this as our set of seasons was
already limited by CPL data availability – losing 1/7th of the total
circulation data would have made our analytic tasks and modeling more
difficult and uncertain. We could have stuck with the “official” launch
date, and in fact, some of our early analyses were conducted in this mode.
Doing so, however, creates an uncharacteristic early “bump” in what
would be considered prior circulation for this title. In Chicago, The Book Thief became a popular summer reading
title well before its fall launch, a phenomenon that denied us a clean
demarcation of “before” and “after launch” circulation. By elimination,
then, we have chosen to use April 30, 2012 (the date the Chicago Sun-Times inadvertently “announced” the
next book) although its official launch by CPL was in September. A
consequence of this complexity is that this book has remained a stubborn
outlier in many of our analyses. One can see in Figure 2 below how The Book Thief’s circulation (label BT, blue line)
differs from the other six in its delay from our x-axis zero “launch”
point:

Figure 2.
Book circulation (all branches) for seven seasons of OBOC (2011-2017)
superimposed with the official launch date set to zero on the x
axis.The time series shown in Figure 2 allows us to grasp the effects of promotion
by CPL. One can see that in most cases after an initial burst of interest
(i.e. checkouts) created by the launch date, the checkout totals decline
sharply, for instance see Augie March (green
line) and Animal Vegetable Miracle (orange
line). Other books present different results in their city-wide checkout
totals: Dyja’s Third Coast (yellow line) has
notable swings up and down, as does The Book
Thief. Isabel Wilkerson’s Warmth of Other
Suns (beige line) has no major launch-date “bump,” but
intriguingly keeps a steady background level of checkouts while also
increasing in circulation over the following year. (By contrast, OBOC books
typically witness overall declines in circulation after the launch
date.)
In future work we will examine in detail the meaning of these checkout
numbers, here totaled for all branches but capable of being disaggregated
and plotted for each CPL branch. We are interested in the differences in
checkouts over time per branch, of course, but one can see even with
city-wide totals that after official CPL launches, different OBOC titles
have different spikes of secondary or tertiary interest. What drives the
later increases in checkouts of these titles? Live programming and social
media, we suspect, are crucial factors: an author reads the book at a
library event or posts about it (Kingsolver for instance has a large social
media footprint), or other City of Chicago tie-in events note the book
and/or the season’s theme. In a forthcoming paper about the 2015-16 season
(Dyja’s The Third Coast), we have correlated
records of CPL-sponsored events, checkout data, and social media about the
OBOC program (via Twitter API) to show in detail and at branch-level how the
social word of reading culture does and does not drive book circulation
totals throughout the city.
Library checkout data
We obtained two types of library data from CPL.[20] As indicated above, we were able to obtain CPL transaction
data — a history of how individual volumes were processed in the library system.
Because of inconsistencies in how the data was queried, and a second data
migration occurring more recently, we have all transactions data for some books
and only checkouts for others. (The larger set of CPL transaction types
includes, in addition to checkouts and returns, inter-branch transfers,
renewals, book losses, and holds.) In our preliminary examination of this data
we found that all types of branch-level transactions were heavily correlated
with branch checkouts, and therefore we have used only checkouts in our analysis
below. Our circulation modeling is limited to paperback, hardcover, audio CD
copies as well as “book club in a bag” kits (see explanation below), and
these constitute the vast majority of patron transactions. Although we did have
e-book checkouts available, given that we are interested in analyzing
differences in checkouts between branches and given that virtual checkouts
cannot be associated with one branch, the analysis of e-book transactions is
outside of the scope of this paper. Data that would have been helpful to have
available is the information about readers participating in OBOC events after
purchasing their own copies of the books. We do know from early coverage of the
program[21] that OBOC
selection does drive metro area bookstore sales of the title to some extent, but
a study of book purchasing behavior is beyond the scope of the present
study.
Library holdings data
The second type of data is holdings data recording the number of OBOC books
available at each branch library. This data is a series of transactions
indicating when each OBOC volume was added to the inventory of a branch library,
or accessioned: volume ID, branch, and date. In theory, from this data we would
know how many books were on the shelf at each branch at the moment that the OBOC
book was launched. However, the holdings data that we have indicates only when a
book was added to the collection at a particular branch. In some but not all
OBOC events, branches assembled “book club in a bag” kits containing eight
copies of the chosen text for convenient single checkout. In some branches,
these were treated as a single unit and not accessioned until broken out of the
bags at the end of the OBOC season. In other cases, the books in the bag were
available for separate checkout. The inconsistent treatment of these club bags
meant that “holdings at the date of launch” is not a consistent
representation of how many books a patron might have seen at a given branch
during the season. Our compromise has been to count every copy accessioned by a
CPL branch, regardless of date, under the assumption that the moment of the
“One Book” event would by necessity be the moment
of peak holdings for the chosen title. This way, the “broken out” books are
treated uniformly for purposes of holdings calculations.
Demographic data
The Chicago Public Library has eighty branches scattered throughout a large and
diverse metropolis well known for its history of segregation. To understand how
different groups are participating in OBOC events, we need to associate
demographics with the branch transactions that form our core data. For important
privacy reasons, CPL – like other public libraries – does not retain patron
information associated with book circulation after a book has been returned. The
transaction data is therefore fully anonymous and there are not even
“pseudonymous identifiers” that could be used, for example, to identify accounts
that have participated in multiple OBOC events. In the absence of more detailed
information about branch library users, we use data from the U.S. Census
American Community Survey (ACS) for the area surrounding each branch. Census
data is aggregated by tracts containing approximately 4,000 individuals. We used
a simple geographical rule to associate tracts with branch libraries.
Each of Chicago's 866 census tract was associated with the branch library in
closest geographical proximity, recognizing that this simple approach is only an
approximation of complex patron usage patterns. Technically, this rule was
realized through the construction of Voronoi polygons defined by the locations
of each branch. A Voronoi polygon is defined by n points {p1, .. p n} and
consists of n polygons {P1, …, Pn} where the points interior to polygon Pk are
closer to point pk than to any other point. Census tracts fully contained in a
particular polygon were assigned to the closest branch. Those that spanned
multiple polygons were assigned to all intersecting polygons on the assumption
that users equidistant from multiple branches might spread their visits across
these branches.
Figure 3 shows these branches and their associated polygons. (Branch codes and
names are given in Appendix 2.)
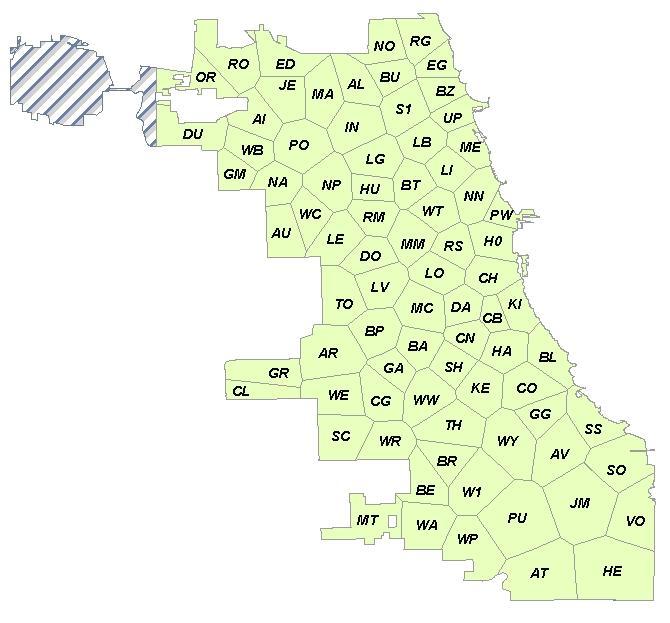
Figure 3.
Chicago Public Library branches and associated Voronoi polygon regions.The
shaded region at the top left is O’Hare Airport, which has no associated
library branch.Our analysis was complicated by the special status of three branches. One is
CPL’s iconic central downtown Harold Washington Library Center (branch code H0),
which is intended to serve the entire city and not just a single local
neighborhood (i.e. the Loop). Harold Washington Library Center is also host to
dozens of OBOC events every season, and always the highest profile ones (i.e.
author readings). The CPL system also has two “regional” library centers:
Woodson (branch code W1) and Sulzer (branch code S1), located on the city’s
south and north sides, respectively. As with Harold Washington, these regional
branches are intended to serve large segments of the city and not just an
immediate neighborhood area. We considered various methods of handling these
larger branches, including treating them on par with neighborhood branches,
thereby ignoring their special status and greater geographic reach. In the end,
however, we chose to treat these branches as having service areas overlapping
with the neighborhood system. Harold Washington is represented by city-wide
aggregate demographics and the two regional branches are represented as a
separate “system” of two polygons for the halves of the city that they
cover.
With the assignment of tracts to branches complete, we could then calculate
aggregate demographics for each branch. The American Community Survey contains
approximately 180 variables reflecting a wide variety of social indicators,
including race, age, type of employment, average rent paid, commuting patterns,
and many others.[22] To capture
large-scale demographic variation across branches, we used principal component
analysis (PCA) to create a set of projected dimensions capturing the largest
proportion of variance in the ACS data over our polygonal regions. The core
concept behind PCA is that a high-dimensional data set may have internal
regularities that make some dimensions essentially redundant. For example, it
may be that property values and rent are highly correlated. The data set needs
only to retain one of these features to capture information about the relative
wealth of different regions. PCA takes this concept one step further by creating
new dimensions that are linear combinations of the existing ones. Such projected
dimensions can be difficult to interpret, but they have the benefit of being
mutually orthogonal, meaning that they have no overlap in the aspects of the
data that they represent. From our PCA decomposition of the census, we
identified seven factors that account for 85% of the variation in the
demographic data. Of these, the first four account for 75%, meaning that if a
neighborhood is represented by just these dimensions, rather than the original
180, the demographic information will differ from the true value by no more than
25%.
To gain an understanding of the consequences of these features for the library
regions, we performed unsupervised clustering of the branches based on their
demographic characteristics. We used the Partitioning Around Medioids (PAM)
algorithm [Kaufman 1990], which is known to be more robust to noise and outliers
compared to the more widely-used k-means algorithm. PAM is more
computationally-intensive than k-means, but for our small data set, this was not
a significant drawback. We explored various combinations of cluster counts and
selected features, using the silhouette metric to discriminate between the
different choices. Our final set of five clusters was created using the top
eight principal components and had an average silhouette width of 0.3. Figure 4
shows these clusters, and includes patterns perhaps familiar to students of the
segregated history of Chicago. A number of “near-north” neighborhoods with
higher property values are found in cluster 5. Surrounding them in cluster 2 are
diverse neighborhoods with many rental property units. Majority African-American
areas on the south and west sides of the city are grouped in cluster 4. Hispanic
areas are found mostly in cluster 3. Cluster 1 is the so-called “bungalow
belt” of historic ethnic neighborhoods, now occupied by a diverse mix of
residents, distinguished from some of the other areas by a higher rate of home
ownership — note the inclusion of Chicago’s Chinatown (CN branch) in this group.
The three regional libraries are treated as a single separate cluster for
analysis.
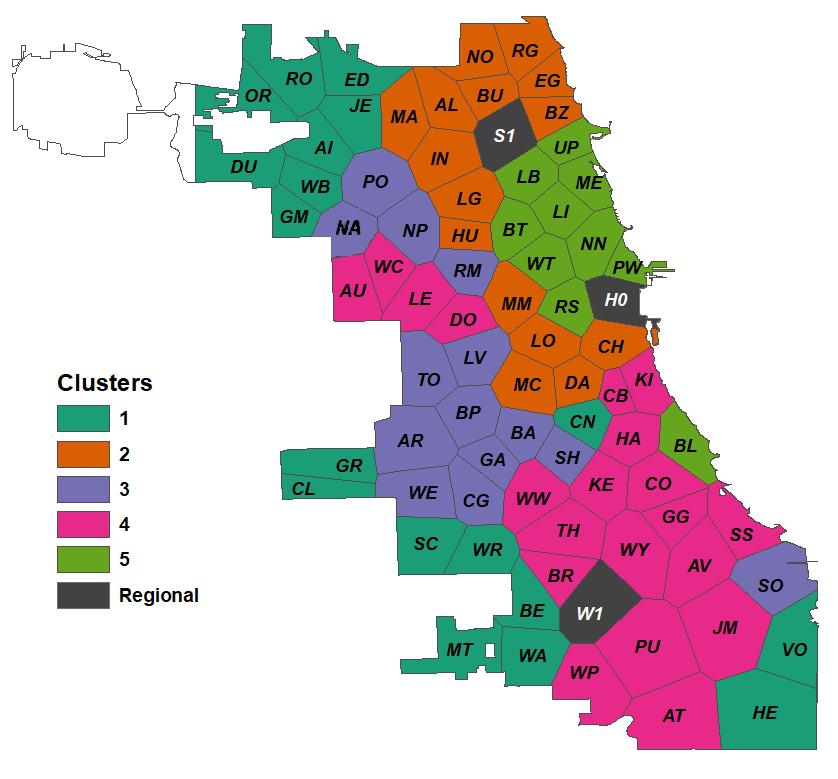
Figure 4.
Branch library regions colored by cluster.Textual measures data
Our last key data source is textual measures of the books themselves. In this,
our project differs from much prior work using quantitative methods of full-text
analysis in several ways. One major difference is the great heterogeneity of the
texts in our corpus: our text set contains both fiction and non-fiction, and
ranges from a modernist novel to short stories to a young adult title and (in
the non-fiction) from a food memoir replete with actual recipes documenting a
single year to the scholarly works of Wilkerson and Dyja covering decades of
U.S. history. The books in our set also vary widely in length, from 70,000 words
(Gold Boy, Emerald Girl) to about 260,000 words
(Augie March), and in other stylistic measures
such as type-token ratio and sentence length, as will be shown below.
We should also note that all of the recent OBOC works are in copyright — indeed,
only Bellow’s Augie March is more than 20 years
old. Because of the small size of our collection, it was possible to use text
extracted from ePub files. However, this would not be feasible at larger scale,
and the only option for full-text processing at scale is the Data Capsule
feature of the HathiTrust Research Center[23] which offers
computational access to in-copyright texts. When we began our analysis, only
four of our seven selections were available in the HathiTrust digital library
data capsule: Augie March (AM), Book Thief (BT), Kavalier and
Clay (KC), and Gold Boy Emerald Girl
(GB). We added additional files to the data capsule to complete the set: Warmth of Other Suns (WS), Third
Coast (TC), and Animal, Vegetable,
Miracle (AV). With these additions, it was possible to apply
non-consumptive analysis to all seven of works in Table 1 within the HathiTrust
data capsule environment.
Analysis
There are many kinds of analysis we might undertake with these various data
sources. In this article, we discuss our work to model normalized branch-level
circulation. Such a model will ultimately enable predictive insight into
correlations of city-wide book checkouts and city-wide OBOC book
promotion.[24] Total circulation would seem an obvious, and
straightforward choice as a measure of popularity. However, we noted that CPL
OBOC book holdings varied widely across branches and a circulation value of 100
would have a very different meaning for a branch with 10 copies as opposed to a
branch with 50 copies. Checkouts per holding would have been a logical
alternative, but we found that some branches (typically smaller ones) had no
copies of some OBOC titles, rendering this statistic meaningless. Our
alternative normalization is to calculate circulation per thousand visitors.
Because we found visitor count to be very closely correlated with OBOC holdings,
this statistic closely tracks circulation per copy.[25] From the City of Chicago Data Portal we
obtained the visitor “gate counts” for all CPL branches for the year
containing the book’s launch. Visitor counts typically change less than 10% from
year to year, except when there is a major change to the physical plant such as
new construction.
One plausible hypothesis regarding OBOC circulation might be that the book choice
is irrelevant to patron participation. One could imagine a relatively-stable
cadre of devoted readers with the time and inclination to pick up whatever text
CPL chose to promote for each season. This would lead branches to have
relatively stable OBOC checkouts over the seasons studied. We analyzed
circulation patterns to determine whether this hypothesis might hold. Figure 5
shows a visualization of normalized circulation at each branch for each book.
The seven columns are seven seasons of OBOC 2011-17 with the book title
abbreviation at the foot of the column. The colors given to the two-letter
branch codes in each column are the colors of the six clusters we described
above, based on demography of neighborhoods. Note that the y axis is a
logarithmic scale – so for example the lowest scoring branch (DO: Douglass, just
west of the Loop) for the AV text has 1/100th the circulation per 1k visitors of
the RO (Roden, in Norwood Park) branch at the top end of the scale. We see that
the branches vary widely in their OBOC circulation. We also see that relative
interest in the OBOC book is not consistent for a particular branch from season
to season. For example, the DO branch is at the bottom for Animal Vegetable Miracle but closer to the middle of checkout
totals for Augie March and Warmth of Other Suns. The AL branch (Albany Park, in the northwest
of the city) has the most normalized circulation for Kavalier and Clay but is near the bottom for Book Thief. Clearly, the book choice matters, and different books
appeal to different audiences at different branches. This is perhaps not
surprising, but was important to establish at this phase of the study.

Figure 5.
Normalized branch circulation by book, colored by cluster.To understand the interaction between demography and circulation in greater
detail, let’s examine a single book: Thomas Dyja’s The
Third Coast: When Chicago Built the American Dream (2013) [TC, and
the selection for the 2015/16 season] in relation to the first three components
of our principal components decomposition. Figure 6 shows a scatter plot with
these results. PC1 corresponds (roughly) to property value, with lower (more
negative) values corresponding to wealthier neighborhoods. We see a linear trend
with some substantial outliers: for example, CH (Chinatown branch) below the
trend line — i.e. wealthier (and abutting the rapidly gentrifying south loop)
but with lower circulation, and ED (Edgebrook) above the trend, i.e. median
wealth but with higher circulation. Readers familiar with Chicago neighborhoods
might hazard guesses about this output: despite similar wealth figures,
Chinatown residents near the center of Chicago were less likely to read The Third Coast — a book centered primarily on north
and south areas of the city — than far-north residents in Edgebrook. Because of
the limited amount of data available we cannot trim these outliers, but instead
must recognize that any kind of linear model will be an inexact fit. A similar
observation can be made for PC3, which corresponds to a combination of the
renter/home-owner axis and age, with lower (more negative) values corresponding
to more owner-occupied housing and more residents above age 35.
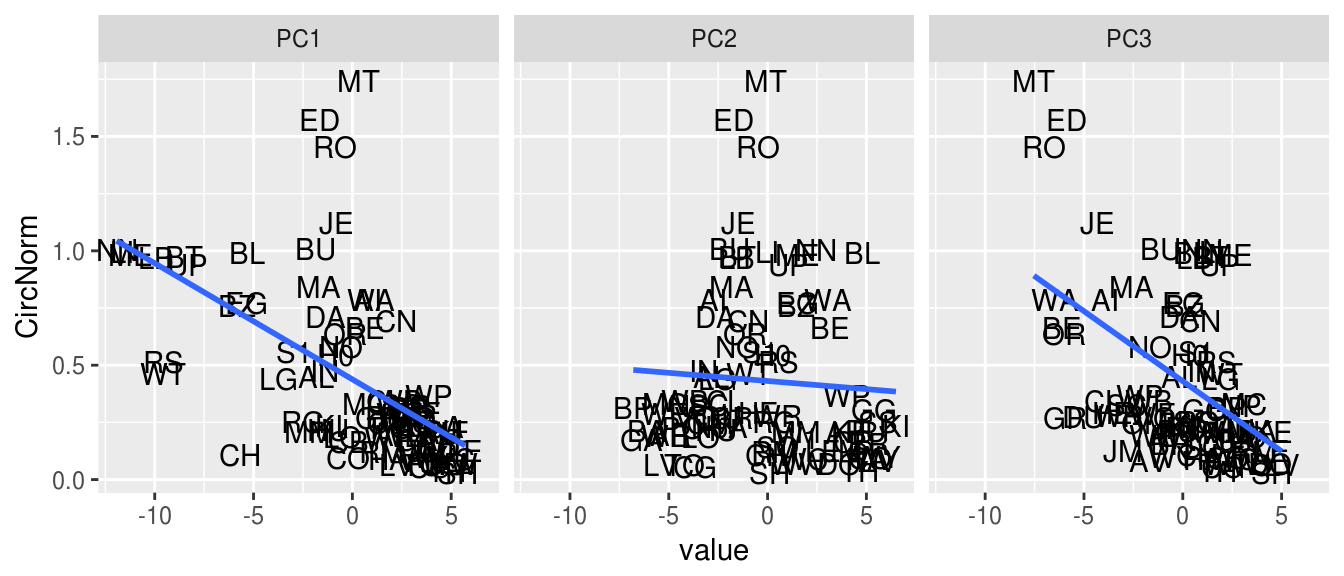
Figure 6.
Trends for circulation vs branch demographicsHowever, PC2 is different. With this feature, we do not see an overall linear
trend. Rather the extremes of negative and positive are lower, and peak
circulation occurs at values around zero. This component corresponds to a
race/ethnicity spectrum with Latinx communities on the negative end of the scale
and African-American ones at the positive end. We experimented with various
transformations of the PC2 variable and ended up with the following square
transform:
The ⅕ factor was added to scale the value to a range similar to the other
principal components. A comparison between the original PC2 and the transformed
PC2X variables is shown in Figure 7.
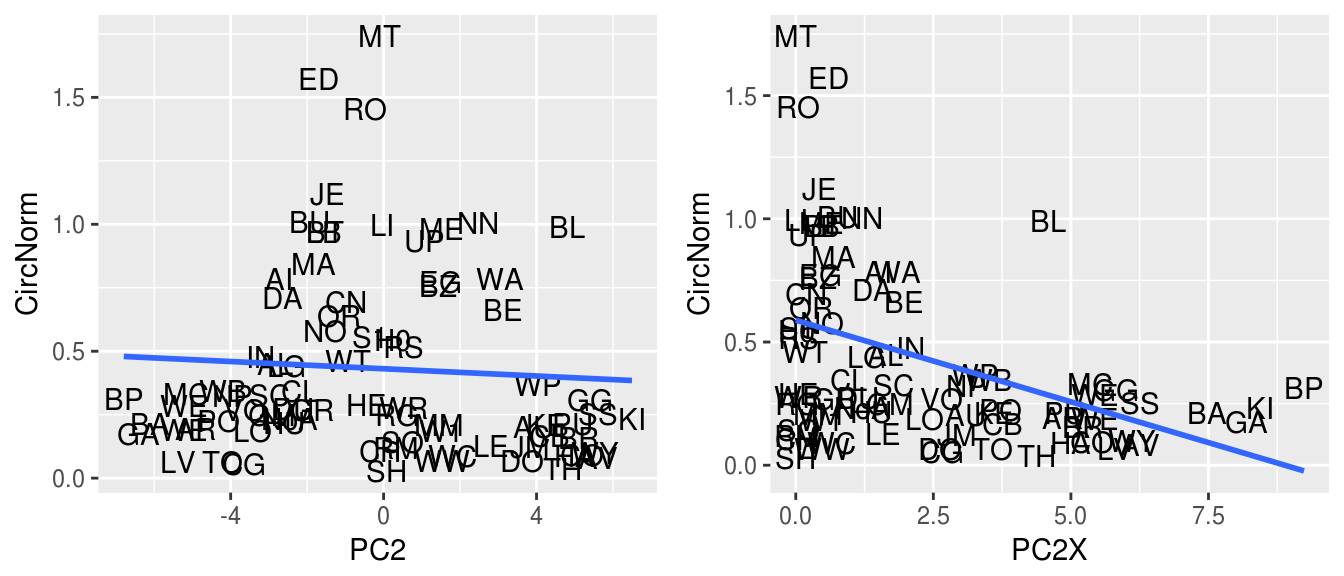
Figure 7.
Circulation trend with principal component 2 and transformed
version.Although the analysis above examines only the data for a single book, other OBOC
seasons show similar patterns. A complete analysis of the circulation data for
all of the seasons can be found in the “Results” page of our project website
(see endnote 3).
Circulation Modeling, Part I
To understand the magnitude of the impact attributable to book choice, we
constructed a multi-level linear regression model of the aggregate branch-level
circulation. A regression model has the form:
y
=
β
0
+
β
1
x
1
+
β
2
x
2
+
.
.
.
+
β
k
x
k
where the
x
i
values are features being used for prediction (for example, a
demographic characteristic of a neighborhood) and the
β
i
values are coefficients fit to the model to maximize its predictive
accuracy. A multi-level model adds an additional set of terms to this predictor
that are book-specific. For example, the model for the circulation of Saul
Bellow’s Augie March (AM) has the following form:
where the
γ
i
A
M
are book-specific coefficients. In this type of model, the
β
i
coefficients are known as the fixed effects and the
γ
i
A
M
coefficients as the random effects. A different set of
γ
values is fit for each book, enabling us to determine how the
relationship between neighborhood demographics and circulation varies by
book.
A range of different models was constructed with different subsets of the
demographic principal components. These models were evaluated on their ability
to account for the existing patterns in the data, yielding the closest fit to
the observed data. The best fitting model is described here and included four
independent variables: the branch-level holdings (“Holds” in the figures),
principal components 1 and 3 (PC1 and PC3) and the transformed version of
principal component 2 as described above (PC2X).[26] Coefficients in the fitted model provide a quantitative measure of the
relationship between the independent variables and the circulation, as impacted
by the choice of book.
What we learn from this model fits well with intuition gleaned from the analyses
above, but sharpens it to identify specific aspects of the data. Figure 8 shows
the coefficients learned for the demographic attributes for each OBOC book —
both the
β
i
and the
γ
i
values from the equation above where i > 0. Because the
coefficient values are small, they are scaled here by 1000, in effect undoing
the per-thousand-visitors transformation applied to the circulation data. The
fixed effect (
β
i
) coefficients for the three demographic parameters show a very large
general effect associated with dimensions 1 and 3 and much smaller one for the
(transformed) second component. In general, then, greater wealth and greater
homeownership and age are correlated with OBOC participation and the particular
book has a smaller effect. Interestingly, this wealth effect is enhanced most
substantially for TC, but diluted for GB and to a lesser extent, BT.
The second demographic component, which in its transformed state corresponds more
or less to a white+other (at zero) vs black+hispanic axis, shows more dramatic
variation. The overall impact of this PC2X axis is not large compared to the
other components (7 checkouts per season vs 30-40), but the variation relative
to the book choice is more significant. Note Figure 8, and the PC2X results
(middle third of the figure): the between-book variation follows patterns that
we anticipated. As might be expected for a book about the Great Migration in
which Chicago’s African-American community plays a large part, WS reverses the
otherwise largely downward trend of the axis: that is, more copies of Warmth of Other Suns were checked out in libraries
with larger black+hispanic patrons. (To a lesser extent, The Book Thief also shows this phenomenon.)

Figure 8.
Fitted coefficients demographic variables in the multi-level model.Figure 9 looks at the coefficients for the CPL Holdings variable — that is, the
number of books assigned to a particular library branch. As expected, there is a
strong general effect of approximately 3 checkouts per book: it is a more
involved process for a patron to check out a book not currently on the shelf at
the branch. Some books, however, show greater “shelf appeal”, and for some,
like WS, this effect is negative, suggesting that patrons were sufficiently
interested in this title that lack of branch copies was not much of a
deterrent.
Finally, Figure 10 shows the “intercepts” for the model, that is the
β
0
and
γ
0
values from the equation. These are not multiplied by any of the
model features and therefore serve as a baseline level of popularity for the
program overall and for each OBOC title. We see here that the baseline effect is
strong. Choosing a book for the OBOC program will typically add more than 300
checkouts for a typical CPL branch over the season. Different books have, of
course, different levels of general interest as shown in the book-specific
intercepts: BT, TC, and WS were more popular than average; GB had the lowest
general appeal.
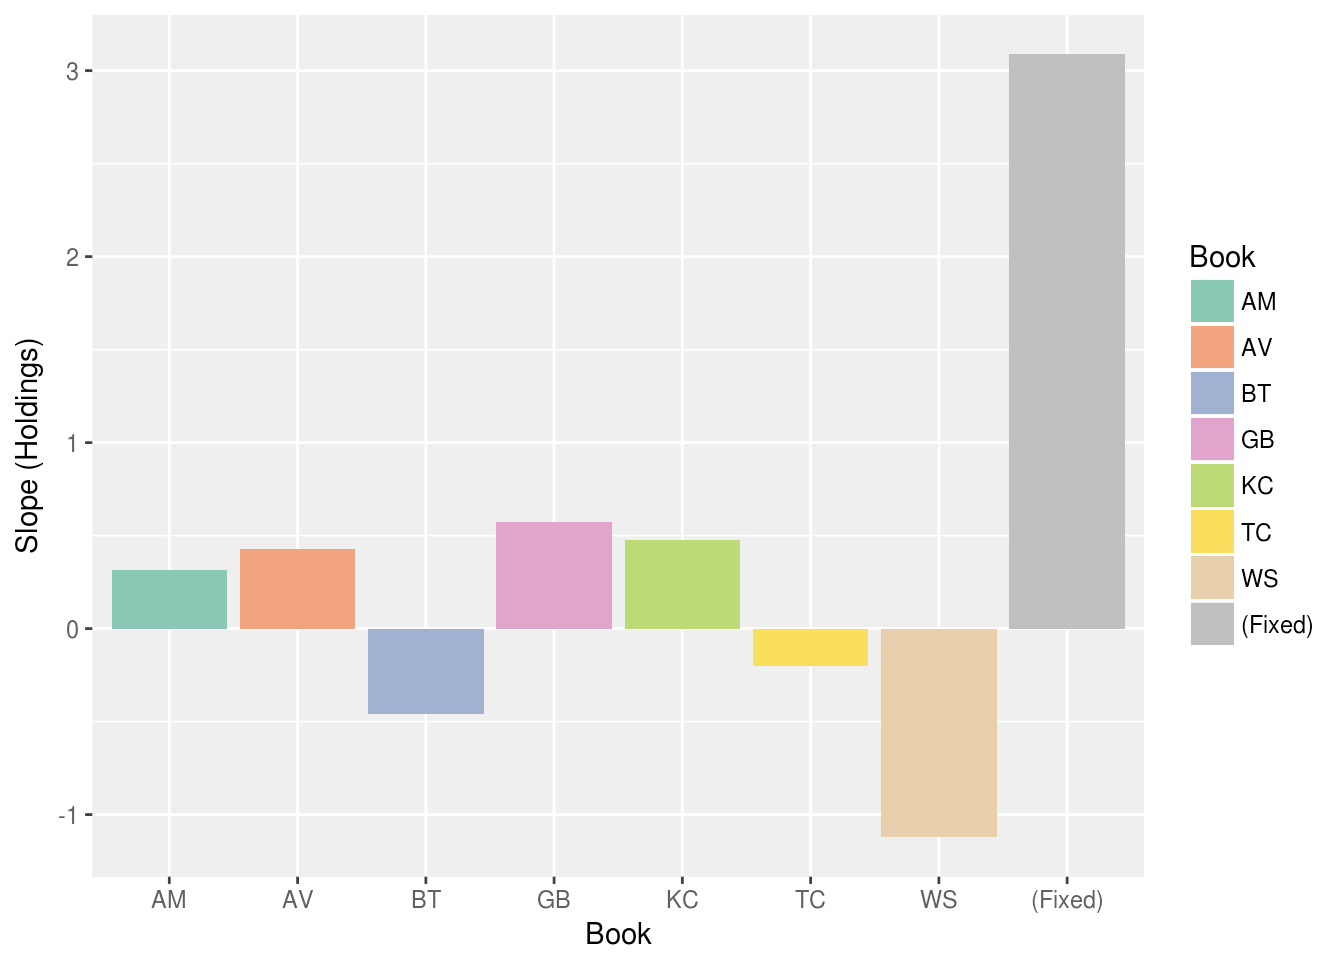
Figure 9.
Fitted coefficients for branch library holdings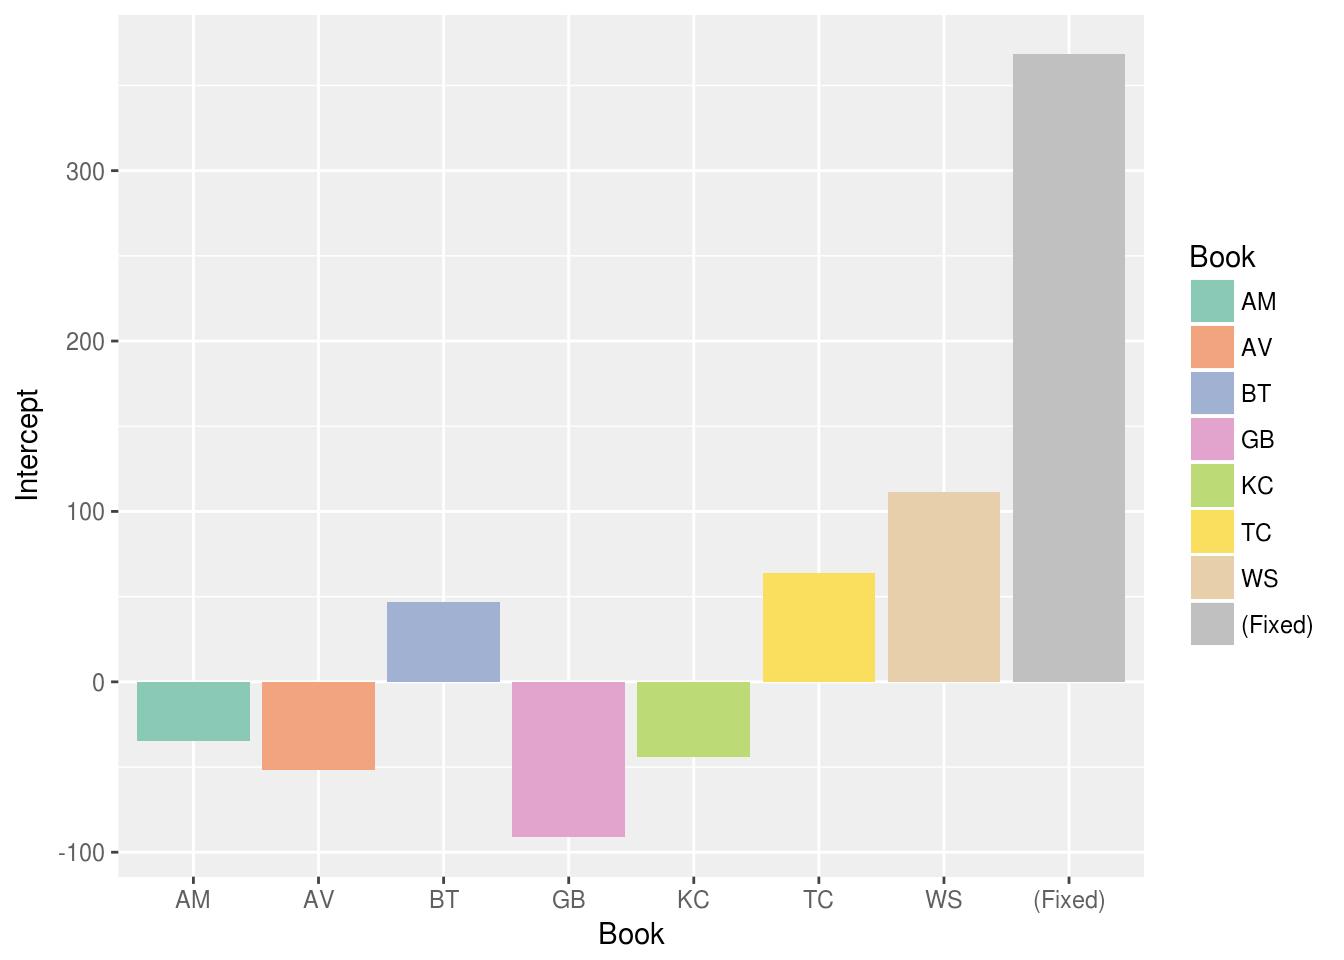
Figure 10.
Fitted interceptsCirculation Modeling, Part II
This first stage of modeling highlighted the heterogeneity of the book choices
and of the OBOC patron audience. Books have clear differences in their overall
appeal and in their specific appeal to different patron groups. However, this
finding raises the question of what features of books cause them to appeal to
different audiences within the city. From the start, a motive of the project has
been to capture quantitatively, branch by branch and over time, the differential
appeal and impact of literary works. We considered various types of textual
features that might be extracted from our texts. However, we were confronted
repeatedly with the challenge of the differences between the texts such as
length, reading level, genre, and still other traits. We needed to identify
features sufficiently generic that they could be extracted from any text in our
set — but also for any future book — in order to begin modeling
“unannounced” books for city-wide checkout predictions. Based on our
discussions with CPL staff, we hypothesized that reading “difficulty” and
text length would be important indicators, with some patrons less likely to pick
up OBOC selections that overtly present greater reading challenges.
Text characteristics
There are many ways to calculate a “reading level” or degree of difficulty
for a text or set of texts. Conventional indices of difficulty cannot tell the
whole story, however, as they do not take into account the subject matter or
the organization of the text but rely on the surface characteristics such as the
occurrence or absence of “difficult” words or measures of sentence length
[Dawkins 1956]. Numbers do not automatically align with the actual reading
experience. For example, in our first efforts in modeling we noticed that the
dense and allusive Adventures of Augie March scored
lower on some measures than the relatively simple prose of Li’s Gold Boy Emerald Girl. Such numerical findings in
isolation did not, we felt, make sense of the quite different reading
experiences involved. To address this, rather than rely on any single text
measure we created a combined measure using the following four text
attributes:
- Average sentence length
- Dale-Chall reading difficulty[27]
- Type-token ratio
- Total number of words
Our text measures were obtained by running a Python-based readability program on
scanned volumes of OBOC selections in the HathiTrust secure data capsule.[28] We extracted the main text of each work and then tokenized it into
sentences. We then extracted ten samples containing approximately 10,000 words
each and computed the reading measures above (except for total number of words)
on each sample. Then we averaged over the samples to produce the reading
measures shown in Table 3 and Figure 11.
| Title abbreviation | Number of words (punctuation excluded) | Average sentence length (punctuation excluded) | Dale-Chall Index | Type-token ratio | Combined difficulty |
| AM | 263,427 | 16.17 | 8.03 | 8.61 | 0.43 |
| GB | 71,138 | 21.40 | 8.27 | 9.90 | 0.38 |
| BT | 127,838 | 10.58 | 8.08 | 7.34 | 0.08 |
| WS | 212,613 | 19.02 | 8.53 | 9.60 | 0.53 |
| KC | 240,216 | 16.89 | 8.89 | 9.20 | 0.54 |
| TC | 150,166 | 24.10 | 10.47 | 11.50 | 0.85 |
| AV | 125,849 | 18.67 | 9.50 | 11.11 | 0.60 |
Table 3.
OBOC text measures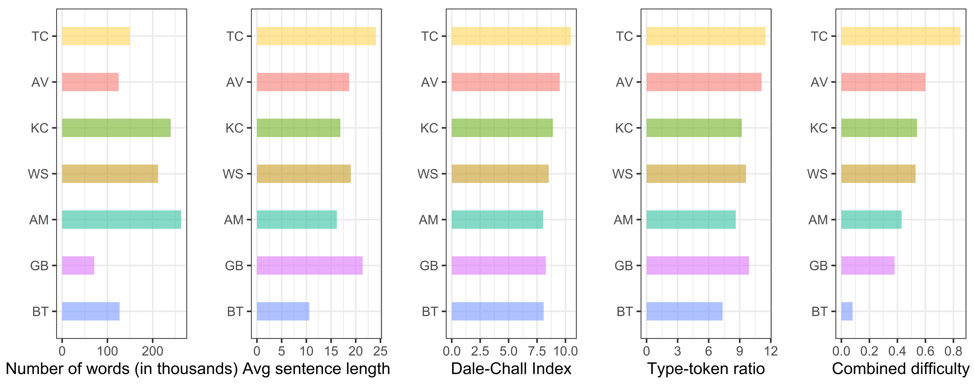
Figure 11.
OBOC text measures visualizationThe final column of Figure 11, “Combined difficulty”, is a normalized
aggregate of the other four measures. We first normalized each measure so that
the highest-scoring book has a value of 1 and the lowest a value of 0. Although
still based on surface level analysis of the text, we believe that this combined
measure captures more accurately a book’s difficulty. Figure 11 indicates that
The Third Coast shows the highest average
sentence length, Dale-Chall Index score, and Type-token ratio, and has the
highest combined difficulty score. Both non-fiction works in our set, The Third Coast (TC) and Animal,
Vegetable, Miracle (AV), score higher in reading difficulty and
therefore stand apart from novels such as The Book
Thief.
Locality features
The nature of place and locality in narrative has generated a lot of exciting
research in (digital) humanities, from renewed attention to the concept of
“chronotopes” to feature extraction and mapping work for corpora large
and small.[29] For our purposes, locality can serve as
a way to identify the “Chicago-ness” of a title and its geographical
connection to the city and its readers. Early analyses suggested that some
clusters of residents had stronger interest in local titles than others, and
this suggested to us the value of this feature. Forthcoming papers will document
our mapping work. In the meantime, some visualizations can be found at the
project website.[30]
Because of the aforementioned findings about the importance of location in book
selection decisions, we were most interested in extracting places names from the
texts and establishing each book’s geographic locus. But disambiguating named
entities of any type, including place name references, is challenging, as [Evans and Wilkins 2018] and others have noted. Our approach was to use the
output of the Stanford Named Entity Recognizer (NER) 3.9.1 version [Finkel et al. 2005], using the default model for location extraction
included in the parser. Although we were working with a scanned version of the
text included in a digital library, we found the accuracy of this parser to be
acceptable for this purpose [Rodriquez et al. 2012]
[Atdağ and Labatut 2013]. Problems arose, however, when we tried to associate
toponyms extracted from the text with their geocoordinates. For example,
“Odessa” and “Paris” can be cities in Texas or in Europe.
Likewise, “Gold Coast” has a specific local meaning in Chicago, but is also
the name of several other places around the world. Our workflow made use of the
Google Maps API to resolve toponyms to latitude and longitude coordinates and,
as might be expected, without knowledge of the literary context of each toponym,
the system could not resolve such ambiguities correctly in many cases. A
particularly evocative example we encountered was the numerous references in
The Third Coast to the once-famous “Mecca”
apartment building on the south side of Chicago (immortalized in Gwendolyn
Brooks’s 1968 book of poetry In the Mecca). The
Mecca building was demolished decades ago to make room for the expanding campus
of Illinois Tech on Chicago’s south side, but Google Maps unsurprisingly locates
the place name in Saudi Arabia. Ultimately, this problem was solved by the
manual examination and correction of each extracted toponym in its textual
context together with the computed geolocation. [31]
A further problem with toponyms is how they occur in a hierarchy of specificity,
with higher levels of the hierarchy resolved by the mapping API as centroids of
a region. For example, the place name “Russia” yields a latitude and
longitude pair placed in the middle of Siberia, which is geographically correct
in an abstract sense, but unlikely to be the part of Russia to which any
particular author is referring — and certainly not Chabon in Kavalier and Clay [KC], from which this example is
taken. This problem does not admit of an easy all-purpose solution. Our simple
expedient was to eliminate all place names with greater than “city” extent.
Our rationale here is that a text gains its geographical purchase from the
accumulated mention of specific locations, not from references to large abstract
entities. To produce our locality measures, we computed the distance from each location to a zero-point centered in the Loop in downtown Chicago and averaged these distances. So that local national distances are not swamped by transcontinental ones, we took the logarithm of the value and used this as our measure of the “distance” of the text from the city. We also experimented with a
version of the model in which this continuous distance value was replaced with a
simpler binary distinction between local (that is, Chicago-centered) texts (AM,
TC, WS) and non-local ones (AV, BT, GB, KC), also computed using the same
toponyms.
Predictive Model
Historical circulation models offer a great deal of insight into the patterns of
OBOC participation, as we have seen. To ask “what if” questions about books
that might be chosen in the future, however, we need a different kind of model.
This predictive modeling task builds on the work above, which allowed us to
identify the most important demographic variables and get a sense of their
predictive utility. In effect, we are seeking to replace the discrete individual
books in the prior model with descriptive variables that capture some aspects of
the books' contents as discussed above.
As with our prior methodology, the model serves multiple purposes. The ability to
predict with some degree of precision indicates that the variables we have
chosen for the model do, in fact, capture regularities associated with branch
circulation outcomes. This helps us have confidence that the model is in the
right form and has the right variables in it. The predictions coming from such a
model may be useful to library staff in anticipating how different book choices
might engage different patrons across the city. Finally, and most importantly
for a digital humanities audience, the importance that the model assigns to
different features gives us a sense of the impact of different variables on the
final outcome.
As above, the dependent feature of our predictive circulation models is
normalized circulation value: that is, checkouts at a given branch per 1000
visitors. As we have described above, the new independent variables are:
combined reading difficulty score, degree of promotion (i.e. number of events at
branches), and locality. The values are combined with the variables from the
earlier analyses: three demographic variables and the number of holdings. For
the first model, MPrior, we added the book’s prior circulation (previous 90
days) at that branch. With prior circulation as an input variable, we are
enabling MPrior to predict the impact of the library’s selection of a particular
book. What, in other words, is the change in circulation pattern induced by a
book’s selection? This is interesting to the library, since it may make less
sense to pick as a “One Book” selection a text that
many people would have read anyway. But it is also interesting for our purposes
since it reflects the impact of the “civic” motivation of the act of book
selection. The model without prior circulation (MCirc) is interesting to us for
a different reason: with this model, we predict de novo what the
match between demographic and book characteristics might say about a book’s
popularity at a given branch given a particular level of investment by the
library system (in promotions and book holdings).
The model type we chose is a boosted regression tree, an appropriate model for
learning the relationship between a numeric output variable and a diverse set of
input variables.[32] Regression tree learning is a form of decision tree learning, where the
system builds a complex set of decision rules, each of which is a test against
the values of a particular feature. For example, the top level of a decision
tree might ask if the value of the PC1 variable is greater than 0.5, and if so,
the rules on one side of the tree are applied, otherwise a different set. The
power of the gradient boosting algorithm is that the system iteratively
determines which cases in the input data generate the most error and focuses
additional learning on getting these predictions correct. A typical boosted
regression tree model might contain hundreds of such rules, knitted together in
a complex pattern of choices.
Our model was trained and evaluated using a cross-validation technique. In each
step of evaluation, one OBOC season was omitted and the model was trained on the
other six seasons. Then the model was used to predict the missing year and the
error calculated. This was repeated across all seven years, and averages
computed across all years. The average mean absolute error for MPrior was 0.017.
(Recall that all values were normalized between 0 and 1, including the
circulation.) This average of 1.7% corresponds to about 7-8 checkouts in a given
branch. The corresponding value for MCirc is 6%, or about 3.5 times as high.
This is not surprising as this model has much less information to work with.
However, it is still within 10% of the actual checkout total.
As noted above, our primary interest in this paper is not in predictions per se,
but rather what the model tells us about the features under study. Figure 12
below shows the feature importance for different input features in MPrior. As
noted above, the tree itself consists of hundreds of choices in complex
combination; the feature importance is a statistic that reflects the overall
utility of a particular variable across all the predictions the system makes. It
does not offer any insight into the structure of the tree itself. The feature
importance values shown here are averages across all seven learned models, and
were relatively consistent across the different model runs.
Figure 12 also shows that the importance of prior circulation is very high, which
is not surprising since it reflects the pre-existing interest of a particular
set of patrons in a particular text. The other variables in descending order of
importance are Holdings, Difficulty, PC1, PC3, PC2X, Promotion, and Proximity.
(Note that feature importance values are not probabilities and do not sum to
100%.) The “shelf effect” noted above (see Figure 9) is substantiated here.
The number of books allocated to a branch does indeed have an impact on patron
behavior over and above the prior interest indicated by patrons. Also, we see
that our combined reading difficulty measure contributes to the predictions.
Feature importance does not indicate the direction of influence, but from other
data we know that this influence is negative — i.e. the more difficult the book
by this measure, the fewer patrons will check it out. It is also worth noting
that, in general, reading difficulty measures track the fiction/non-fiction
genre divide, with non-fiction books generally scoring higher. At this point, we
do not have enough data to firmly disentangle the effects of reading difficulty
for this fiction/nonfiction distinction. Finally, we have the demographic
variables, especially the PC1 (property value) and PC3 (owner/renter) axes. At
lower levels of importance are the number of OBOC outreach events held and the
locality measure (“proximity”) of the text.
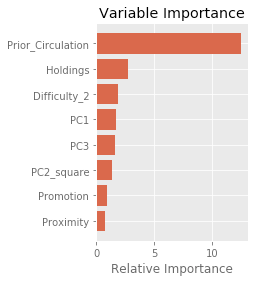
Figure 12.
Average feature importance for MPrior circulation models.Figure 13 contains similar importance values for MCirc, but now prior CPL
circulation is not considered. Here we see that the roles are reversed between
the set of demographic variables and the holdings/reading difficulty measure.
The prior circulation variable in MPrior is, to some extent, building in the
baseline appeal of the book to the patrons of a particular branch, and when this
variable is removed the demographic factors become a stronger element. In some
ways, this brings us back to one of our original research questions – namely,
the relationship between demography and OBOC participation. Here we see effects
of PC1, PC3 and PC2X similar to those found in the multi-level model. Once we
get past these effects, we have a consistent pattern relating holdings, reading
difficulty, promotional events, and proximity.

Figure 13.
Average feature importance for MCirc modelsOur final model examined the impact of using a binary Chicago/non-Chicago feature
as our representation of a text’s locality rather than the quantitative
proximity values used in the other models. We call this model MBinary.
Interestingly, the average mean absolute error on this model was approximately
0.018, which is slightly but not significantly improved over the MPrior model.
Figure 14 shows the average error for the three models expressed in terms of
normalized circulation.
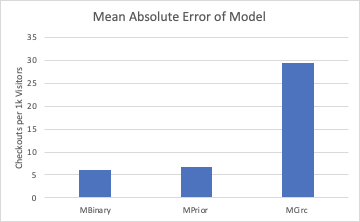
Figure 14.
Average model MAEFigure 15 shows the average feature importance for the MBinary model. The values
are very similar to those found in Figure 12, with the binary feature showing a
small, but non-negligible contribution to the model performance. The results for
MBinary are quite important as they demonstrate that high accuracy in toponym
attribution is not essential to making use of locality in circulation modeling.
It is sufficient to label a book simply as Chicago-connected or not, and we
expect that this will be possible without the manual effort required to achieve
high accuracy for each geographic label.
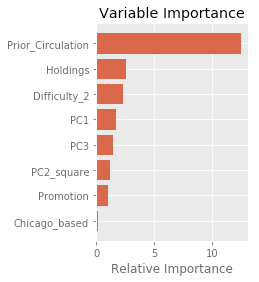
Figure 15.
Average feature importance for MBinary modelsLimitations
The analyses above have some gaps that we hope to address in future research. For
instance, although the period in question has seen greater use of e-books by CPL
patrons, we have not yet included e-book checkouts in our analysis. (Because
e-book checkouts are not associated with particular branches, we would not have
been able to build them into branch-level circulation models.) However, e-book
usage is almost certainly correlated with neighborhood demographics and
therefore represents “missing” checkouts in certain areas. A similar point
could be made about book purchases. Chicagoans with the resources to purchase a
copy of the selected OBOC text rather than read a library copy are obviously not
represented in the CPL circulation data. Thus, we expect that our models
underestimate total OBOC participation, particularly in more affluent areas of
the city.
A limitation in our analysis is the limited number of texts we were able to use.
80 branches and seven books constitute less than 600 circulation data points.
The texture of the model can be enhanced in several ways, however. One way would
be to obtain year-by-year demographic data for each branch rather than using a
single year’s census data to stand in for the whole time period. As it is now,
only 80 combinations of the demographic factors can appear, and therefore
interrelations between the factors are difficult to discern. In general, we
would not expect this to change the results much, but in neighborhoods
experiencing rapid or marked demographic change it would provide a more accurate
representation.
Richer data can also be obtained by looking at additional books. We have obtained
the branch-level circulation data for 309 books chosen by CPL as recommendations
associated with each of the seven recent OBOC seasons (the “if you liked this
book, you might also like ...” feature that appears regularly on the CPL
website, on program flyers, and in branch libraries). These books were selected
by CPL for thematic or other similarities to the OBOC choices and therefore
provide an interesting, if idiosyncratic, control group: books that did not
receive the full promotional boost of the official OBOC selected texts but were
brought to the attention of patrons nonetheless. With these 300+ additional
texts, it would be possible to extend MCirc by adding a binary variable
distinguishing the “selected” vs “recommended” texts.
Another limitation is working exclusively with in-copyright texts. Both the set
of seven recent OBOC selections and the extended corpus of recommended texts
contains many in-copyright works and therefore our text processing can only
occur, painstakingly, through the non-consumptive text processing capabilities
of the HathiTrust Digital Library. We have also found that many of the texts in
this extended data set are not held in the HathiTrust collection. For the works
that are present, working from scanned OCR-ed text entails significant
difficulties in calculating some of the text properties that we have relied on
in this analysis to date. We have discovered significant biases in the
calculation of reading difficulty. Most challenging is the determination of the
location/proximity variable, which in the end required manual checking — a
process that does not scale up to a larger corpus. This is one reason that the
MBinary model is of interest: we expect that assessing a simple
Chicago/non-Chicago placement of a text will be less error-prone than the
calculation of distances for each toponym, although the case of the “Mecca”
building is an important cautionary tale.
As in other disciplinary contexts, merging data from heterogeneous sources is a
difficult task with no easy or standardized solutions. Each type of data —
branch demographics, library circulation (both checkouts and book holdings), and
book content — poses its own challenge for data curation, normalization, and
integration, many of which have been discussed above. One distinguishing feature
of this work has been our reliance largely on a relatively small number of
heterogeneous in-copyright texts. Thus, we do not have the advantage of
large-scale “distant” text processing where small errors in the
transformation pipeline can be expected to cancel each other out.
Conclusion
Our project has identified several challenges that will be of interest to
scholars in the digital humanities, particularly those working at the
intersection of text analysis, geography, and public data sets. Our original
goal to capture and predict mass literary events has largely been met. As
“capture”, we have created an archive of nearly a decade of multiple
media forms (and metrics for them) associated with a cultural program that has
engaged many thousands of people across a major American city for years. In
pursuit of “prediction”, we have produced a novel predictive model
integrating demographics, book content, and branch data to produce branch-level
predictions of book circulation. With this tool, we plan to generate
branch-level circulation predictions for book titles (OBOC program or not)
beginning in summer 2020. This will be reported in a future paper.
While we expect this predictive model to be of use to CPL staff, it is important
to note that it has not been our intent (nor theirs) to optimize against such a
model in choosing books. One does not need data-intensive modeling to identify
books that circulate highly; for example, a good bet at any time would be
current best-sellers by authors with name recognition who have been highly
promoted by publishers. But maximizing circulation alone has never been
the primary goal of “One Book, One Chicago”. We expect that library
staff will continue to make OBOC text and theme choices as they always have,
through an in-depth process that considers an entire constellation of cultural
and socio-political factors. However, they will now be able to do so with the
help of an additional data source: for any given book, they will also be able to
calculate “what-if” scenarios for all CPL branches and consider different
levels and kinds of promotional activity.[33]
One of the key findings of our predictive model is that prior circulation makes
the largest predictive contribution for the circulation of OBOC selected works.
This is a measure, however, that will be unavailable for new books and
little-known or first-time authors. It is possible, as we have shown, to do
similar types of predictions without prior circulation data, but with
significantly lower accuracy. This is not a surprising finding, but our ability
to quantify the effect will enable library staff to reason about the tradeoffs
inherent in choosing works already circulating well in the local library-system
as opposed to “importing” choices from outside the system in the name of
expanding readers’ horizons.
Additional work remains. One key question of interest to us is the interaction
between kinds of promotional events surrounding a given OBOC season, the sharing
and re-sharing of these events via social media, and subsequent specific branch
circulation outcomes. As shown in Figure 2, the time course of each book’s
circulation shows a variety of different patterns and temporal structures.
Preliminary analysis suggests that, as might be expected, there is a close
association between bumps in checkout numbers and branch events and social media
activity hosted by the library — but there are notable differences by branch and
type of event. However, analysis of this association for each of the eighty
branches remains to be done. We do not know, for example, how different types of
events impact circulation or whether an event at one library branch impacts
circulation at others. We are interested in linking the circulation and event
time-series data to the timeline of OBOC Twitter posts, many but not all of
which are related to specific OBOC events. We have already collected associated
Twitter and Goodreads data for several OBOC seasons and have developed
supervised text classification algorithms to isolate the OBOC-specific tweets
from unrelated content. This relationship between social media activity and
circulation is yet to be quantified, but will be the subject of a future
paper.
Acknowledgements
Research has been supported by DePaul University, the NEH Office of Digital
Humanities (grant HD 248600-16), Microsoft Azure, the Lyrasis Catalyst Fund, and
the HathiTrust Advanced Computing Support program. The project has benefited
from the contributions of numerous talented students at DePaul: the multi-level
linear circulation model was originally designed and executed by Zach Budde and
the predictive circulation model was developed by He (Vicky) Yang. Mihaela
Stoica created event logs for OBOC seasons, wrote for the project blog, and made
manual corrections to data files and maps. Maps and demographic data were
compiled by Nandhini Gulasingam of DePaul’s Faculty Scholarship Support Center.
Thanks to Jessica Bishop-Royse (FSSC) and Megan Bernal (Library) for ideas and
contributions, and to our other student research assistants. Special thanks to
the Chicago Public Library’s Jennifer Lizak, Coordinator of Special Projects for
Cultural and Civic Engagement, and Michelle Frisque, CPL’s Chief of Technology,
Content, and Innovation.
Appendix 1
“One Book One Chicago” Program book selections,
2001-2019
- 2019/20 Elizabeth Kolbert, The Sixth Extinction: An Unnatural History
- 2018/19 Philip K. Dick, Do Androids Dream of Electric Sheep?
- 2017/18 Greg Kot, I’ll Take You There
- 2016/17 Barbara Kingsolver, Animal, Vegetable, Miracle
- 2015/16 Thomas Dyja, The Third Coast
- 2014/15 Michael Chabon, The Amazing Adventures of Kavalier and Clay
- 2013/14 Isabel Wilkerson, The Warmth of Other Suns
- 2012 (Fall) Marcus Zusak, The Book Thief
- 2012 (Spring) Yiyun Li, Gold Boy, Emerald Girl
- 2011 (Fall) Saul Bellow, The Adventures of Augie March
- 2011 (Spring) Neil Gaiman, Neverwhere
- 2010 (Fall) Toni Morrison, A Mercy
- 2010 (Spring) Colm Toibin, Brooklyn
- 2009 (Fall) Carl S. Smith, The Plan of Chicago
- 2009 (Spring) Sandra Cisneros, The House on Mango Street
- 2008 (Fall) Tobias Wolfe, The Right Stuff
- 2008 (Spring) Raymond Chandler, The Long Goodbye
- 2007 (Fall) Arthur Miller, The Crucible
- 2007 (Spring) James Baldwin, Go Tell It on the Mountain
- 2006 (Fall) Jhumpa Lahiri, The Interpreter of Maladies
- 2006 (Spring) Aleksandr Solzhenitsyn, A Day in the Life of Ivan Denisovitch
- 2005 (Fall) Jane Austen, Pride and Prejudice
- 2005 (Spring) Walter Van Tilburg Clark, The Ox-Bow Incident
- 2004 (Fall) Julia Alvarez, In the Time of Butterflies
- 2004 (Spring) Stuart Dybek, The Coast of Chicago
- 2003 (Fall) Tim O’Brien, The Things They Carried
- 2003 (Spring) Lorraine Hansberry, A Raisin in the Sun
- 2002 (Fall) Willa Cather, My Antonia
- 2002 (Spring) Elie Wiesel, Night
- 2001 (Fall) Harper Lee, To Kill a Mockingbird
Appendix 2
| Branch Code and Branch Name |
| AI - Austin-Irving |
| AL - Albany Park |
| AR - Archer Heights |
| AT - Altgeld |
| AU - Austin |
| AV - Avalon |
| BA - Back of the Yards |
| BE - Beverly |
| BL - Blackstone |
| BP - Brighton Park |
| BR - Brainerd |
| BT - Bucktown-Wicker Park |
| BU - Budlong Woods |
| BZ - Bezazian |
| CB - Chicago Bee |
| CG - Chicago Lawn |
| CH - Chinatown |
| CL - Clearing |
| CN - Canaryville |
| CO - Coleman |
| DA - Daley, Richard P.-Bridgeport |
| DO - Douglass |
| DU - Dunning |
| ED - Edgebrook |
| EG - Edgewater |
| GA - Gage Park |
| GG - Greater Grand Crossing |
| GM - Galewood-Mont Clare |
| GR - Garfield Ridge |
| H0 - Harold Washington Library Center (Main) |
| HA - Hall |
| HE - Hegewisch |
| HU - Humboldt Park |
| IN - Independence |
| JE - Jefferson Park |
| JM - Jeffrey Manor |
| KE - Kelly |
| KI - King |
| LB - Lincoln Belmont |
| LE - Legler |
| LG - Lincoln Square |
| LI - Lincoln Park |
| LO - Lozano |
| LV - Little Village |
| MA - Mayfair |
| MC - McKinley Park |
| ME - Merlo |
| MM - Manning |
| MT - Mount Greenwood |
| NA - North Austin |
| NN - Near North |
| NO - Northtown |
| NP - North Pulaski |
| OR - Oriole Park |
| PO - Portage-Cragin |
| PU - Pullman |
| PW - Water Works |
| RG - Rogers Park |
| RM - Daley, Richard M-West Humboldt |
| RO - Roden |
| RS - Roosevelt |
| S1 - Sulzer (Regional) |
| SC- Scottsdale |
| SH - Sherman Park |
| SO - South Chicago |
| SS - South Shore |
| TH - Thurgood Marshall |
| TO - Toman |
| UP - Uptown |
| VO - Vodak-East Side |
| W1 - Woodson (Regional) |
| WA - Walker |
| WB - West Belmont |
| WC - West Chicago Avenue |
| WE - West lawn |
| WP - West Pullman |
| WR - Wrightwood-Ashburn |
| WT - West Town |
| WW - West Englewood |
| WY - Whitney M. Young, Jr. |
Table 4.
Chicago Public Library Branches and Branch CodesNotes
[1] The phrase grounds Clay Shirky’s influential
account of the distinction between browsing and search and the latter’s
success: “One reason Google was adopted so quickly when
it came along is that Google understood there is no shelf, and that
there is no file system”
[Shirky 2005]. On the role of data in design decisions for
libraries, in addition to [Schnapp and Battles 2014] see [Palfrey 2016].
[2] For historically-informed analysis of the data
of contemporary literary production and reception, see [McGurl 2016]
[Hungerford 2016]
[Lynch 2017]. On the importance of “comps”, a marketing
tool still largely unknown to literary scholars, see [McGrath 2019]. On the privacy implications of increased
for-profit reading platform use, even in public library environments, see
[Ard 2013/14].
[3] Visualizations, code notebooks,
and some data sets are available at the RCR project website: https://dh.depaul.press/reading-chicago/
[4] The City of Chicago Data Portal,
containing downloadable data sets ranging from shared bike journeys to crime
statistics, makes “Cook County ... one of the best
places in the nation for thinking creatively about the role of
government in people’s lives”
[Dukmasova 2018]. However, an important examination of smart
city hype that imagines “cities as spreadsheets waiting
for the right formulas” can be found in [Bratton 2015, 160]. On the temporality of data of
“smart” cities, see [Olmstead 2019]. Trenchant
critiques of plans to “imagine cities from the internet
up” can be found in [Mattern 2017] and [Graham et al. 2019].
[5] And importantly, on Goodreads,
LibraryThing, and shared Zotero groups, people publicize taste in ways that
make their reading visible to social media analysis methods. As Nakamura
points out, “Goodreads invites readers to navigate not
in books but in its catalog, to create new catalogs, and to enjoy other
people’s collections” since the “site’s main
purpose [is] to provide users with familiar tools that encourage them to
perform their identities as readers in a public and networked
forum”
[Nakamura 2013, 4, 5]. An early attempt at using
LibraryThing data for book recommendations is [Pera et al. 2010]. For
quantitative analysis of differences in reviews on Goodreads and Amazon, see
[Dimitrov et al. 2015]; for a more recent use of Goodreads for
literary sociology, see [Porter 2018].
[6] On audiobooks, see [Rubery 2016] and [Kozlowski 2018]. On fanfiction, [Thomas 2011],
[Hellekson and Busse 2014], and [Vadde 2017]. On
“post-press literature”, see [Levey 2016] and [Laquintano 2016]. An influential account of transmedia
storytelling is [Jenkins 2007]. The contemporary literary
field is dominated by a few large publishers and Amazon.com — the latter on
its own facilitating one-half of all U.S. print book purchases and 70% of
all e-book purchases [McGurl 2016, 448]. See also [Striphas 2009] and [Sinykin 2017].
[7] See also [Collins 2013].
Bob Stein, founder of the Institute for the Future of the Book claims:
“in the future … we'll think of a book less as a
physical object than as a ‘place to congregate’” (qtd. in
Nunberg 2013).
[8] In addition to work mentioned above (note 7), see Lev
Manovich’s “SelfieCity” (http://selfiecity.net/) and “On Broadway” (http://www.on-broadway.nyc/).
See also [Cranshaw et al. 2012]
[Boy and Uitermark 2016]
[Pinder 2012].
[9] For overviews, see [Davidson 1989] and [Amory et al. 2007-14].
[10] On Oprah’s book club, see [Rooney 2005] and [Striphas 2009, 111–40].
[11] [Long 2003]
[Taylor 2012, 142–58]
[Radway 1997]. On demographic difference in book clubs, see
[Davis 2008, 155–86]. Of book group reading choices,
Burwell notes that encounters with demographic differences are “more likely to occur through textual engagement than
through encounters with other members” (qtd. in Griswold et al. 2014, 27).
[12] And see this trenchant reminder that “filter
effects” have a long, non-digital, history: “[Eli] Pariser is certainly right that personalization disguises one of
today’s key processes for substituting a narrower world for the world
tout court. But in this, the personalization of Web 2.0 may simply be a
subset of a larger and longer recommender system that has gone by many
names: race, gender, sex, sexuality, ethnicity, class, ability — the
original filter bubbles”
[Cohen 2019, 176].
[13] On the so-called “Bilbao
effect” and its endurance, see [Moore 2018]. On the
growing use of people as a distinct medium in contemporary art, see [Bishop 2012]; see also for Chicago specifically [Grams 2008]. On people as a “last mile” technology in
city infrastructure, see [Mattern 2015, 94–112, 106] and
[Barber 2013].
[14]
http://opendatabook.club/. We
owe this reference to [Mattern 2016]. As public libraries
increasingly think of themselves as “platforms”,
in David Weinberger’s influential phrase [Weinberger 2012], we
should also note the growing variety of materials circulated to patrons.
Seattle Public Library, for example, created a wifi hotspot checkout program
in 2014 [Risley 2015].
[15] But note caveats about [Kidd and Costano 2013] and others in [Mumper and Gerrig 2019].
[16] Library of Congress Read.gov list: http://www.read.gov/resources/index.php. [Griswold and Wohl 2015, 99] note creation of their own private
database of One Book programs nationwide. They list 567 programs in all 50
states, covering the years 2000 to 2012, numbering 3110 book selections
(1506 unique books and 1193 unique authors).
[17]
[Fuller and Sedo 2013, 20–1]
[Grams 2008, 195] quotes Seattle Public Library’s
Higashi: “it wasn’t until Chicago chose To Kill a Mockingbird for their One Book One
City project that they got national press, a big article in the New York Times. That’s the point at which the
project really went boom all over the country and indeed the
world.”
[18] See [Griswold and Wohl 2015]. The
social media circuit is changing literary production. Embedding herself at
McSweeney’s and other publishing houses,
Hungerford finds the cutting edge of publishing now is housed at presses and
companies that embed interactive sociality at the core of the reading
experience. English departments and establishment publishing houses are
improvising ways to respond to these “productionist” tendencies; in the
twenty-first century, she asks, “What if literary
culture is a culture of making rather than a culture of reading?”
[Hungerford 2016, 9]. See also [McGurl 2016].
[19] Circulation data prior to 2011
was lost in a CPL software migration and is unrecoverable.
[20] Note that these data sets
are subject to non-disclosure agreements, and we are not able to distribute
them.
[21] See [Putnam and Feldstein 2003, 51].
[22] Our OBOC seasons span seven years in the history of
Chicago, 2011-2017, and the demographics of the city were certainly not
constant during that time. The ACS data we used is from 2015. Yearly
fluctuations in demographic composition of different neighborhoods before
and after that time are not reflected in our analysis.
[24] We have conducted some analysis of other aspects of our
data such as the time-varying patterns of circulation and the interaction
between promotion events and circulation, but we will not discuss these
results here.
[25] Indeed, library staff
confirmed that branch activity was a key factor in the distribution of OBOC
volumes across branches.
[26] The model was fit using
the lmer method from the lme4 package in R. Full model output can be found
on the project website at http://cwi.cdm.depaul.edu/~rburke/circ/multi-level-norm.html
[27]
See Chall and Dale 1995.
[29] See for instance [Moretti 1997]
[Bakhtin 1983]
[Stanford Literary Lab 2016]
[Cordell 2015]
[Evans and Wilkins 2018].
[30] See our sample “geographical
centers” for recent OBOC selections: http://cwi.cdm.depaul.edu/~rburke/location/geo_center.html.
[31] We have begun work on
processes to automate Chicago location checking. Reference works such as
[Kaser 2011] makes this, for our subject city at least, a
bit easier.
[32] The GradientBoostingRegressor class in Python’s
scikit.learn package was used with parameters optimized by grid search.
[33] We are in the process of
constructing a dashboard with interactive visualizations to support such
exploration.
Works Cited
Alharthi et al. 2018 Alharthi, Haifa, Diana
Inkpen, and Stan Szpakowicz. “A Survey of Book Recommender
Systems”. Journal of Intelligent Information
Systems 51 (2018): 139-160.
Alter and Russell 2016 Alter, Alexandra, and Karl
Russell. “Moneyball for Book Publishers: A Detailed Look at
How We Read”. New York Times (March 15,
2016).
Amory et al. 2007-14 Amory, Hugh. et al, gen eds.
A History of the Book in America. 5 vols.
Chapel Hill: UNC Press, 2007-2014.
Anderson 1991 Anderson, Benedict. Imagined Communities: Reflections on the Origin and Spread of
Nationalism. London: Verso, 1991.
Archer and Jockers 2016 Archer, Jodie, and Matthew
L. Jockers. The Bestseller Code: Anatomy of the Blockbuster
Novel. NY: St Martin’s, 2016.
Ard 2013/14 Ard, BJ. “Confidentiality and the Problem of Third Parties”. Yale Journal of Law and Technology (2013/14).
Atdağ and Labatut 2013 Samet Atdağ, and Vincent
Labatut. “A Comparison of Named Entity Recognition Tools
Applied to Biographical Texts”. 2nd
International Conference on Systems and Computer Science 2013:
228–233.
Bakhtin 1983 Bakhtin, Mikhail. “Forms of Time and Chronotope in the Novel”. The Dialogic Imagination: Four Essays. Trans. Michael
Holmquist. Austin: U of Texas Press (1981): 84-258.
Barber 2013 Barber, Benjamin R. If Mayors Ruled the World: Dysfunctional Nations, Rising
Cities. New Haven: Yale UP, 2013.
Bishop 2012 Bishop, Claire. Artificial Hells: Participatory Art and the Politics of
Spectatorship. London: Verso, 2012.
Boy and Uitermark 2016 Boy, John D., and Justus
Uitermark. “How to Study the City on Instagram”.
PLoS ONE 11(6) 2016:
e0158161.doi:10.1371/journal.pone.0158161
Bratton 2015 Bratton, Benjamin H. The Stack: On Software and Sovereignty. Cambridge: MIT
Press, 2015.
Chall and Dale 1995 Chall, J. S., & Dale, E.
(1995). Readability Revisited: The new Dale-Chall
Readability Formula. Cambridge: Brookline Books, 1995.
Cohen 2019 Cohen, Kris. “Literally, Ourselves”. Critical Inquiry
46 (Autumn 2019): 167-192.
Collins 2010 Collins, Jim. Bring On the Books For Everybody: How Literary Culture Became Popular
Culture. Durham: Duke UP, 2010.
Collins 2013 Collins, Jim. “The Use Values of Narrativity in Digital Cultures”. New Literary History 44:4 (Autumn 2013): 639-60.
Cordell 2015 Ryan Cordell. 2015. “Reprinting, Circulation, and the Network Author in Antebellum
Newspapers”. American Literary History
27.3 (September 2015): 417–445.
Cranshaw et al. 2012 Cranshaw, Justin, and Raz
Schwartz, Jason Hong, and Norman Sadeh. “The Livelihoods
Project: Utilizing Social Media to Understand the Dynamics of a
City”. ICWSM 2012: Proceedings of the 6th
International AAAI Conference on Weblogs and Social Media.
Davidson 1989 Davidson, Cathy N. ed. Reading in America: Literature and Social History.
Baltimore: Johns Hopkins UP, 1989.
Davis 2008 Davis, Kimberly Chabot. “White Book Clubs and African American Literature: The Promise
and Limitation of Cross-Racial Empathy”. LIT:
Literature Interpretation Theory 19 (2008): 155-186.
Dawkins 1956 Dawkins, John. “A Reconsideration of the Dale-Chall Formula [with Reply]”. Elementary English 33.8 (1956): 515–522.
Dimitrov et al. 2015 Dimitrov, Stefan, Faiyaz
Zamal, Andrew Piper, and Derek Ruths. “Goodreads vs Amazon:
The Effect of Decoupling Book Reviewing and Book Selling”. Association for the Advancement of Artificial
Intelligence 2015. Available at http://piperlab.mcgill.ca/pdfs/Goodreads_ICWSM_2015.pdf
Dukmasova 2018 Dukmasova, Maya. “Chicago Inside Out”. Places
Journal (October 2018). Online at
https://placesjournal.org/article/chicago-inside-out/).
English 2010 English, James F. “Everywhere and Nowhere: The Sociology of Literature After
‘the Sociology of Literature’”. New
Literary History 41:2 (Spring 2010): v-xxiii.
Evans and Wilkins 2018 Elizabeth F. Evans and
Matthew Wilkens. “Nation, Ethnicity, and the Geography of
British Fiction, 1880-1940”. CA: Journal of
Cultural Analytics. 13 July 2018.
Finkel et al. 2005 Jenny Rose Finkel, Trond
Grenager, and Christopher Manning. “Incorporating Non-local
Information into Information Extraction Systems by Gibbs Sampling”.
Proceedings of the 43nd Annual Meeting of the
Association for Computational Linguistics (ACL 2005): 363-370. http://nlp.stanford.edu/~manning/papers/gibbscrf3.pdf.
Fuller and Sedo 2013 Fuller, Danielle, and DeNel
Rehberg Sedo. Reading Beyond the Book: The Social Practices
of Contemporary Literary Culture. NY: Routledge, 2013.
Graham et al. 2019 Graham, Mark, Rob Kitchin,
Shannon Mattern, and Joe Shaw. Eds. How to Run a City like
Amazon, and Other Fables. Meatspace Press, 2019.
Grams 2008 Grams, Diane. “Creative Reinvention: From ‘One Book’ to ‘Animals on Parade’: How
Good Ideas Spread Like Wildfire”. Entering
Cultural Communities: Diversity and Change in the Nonprofit Arts,
ed. D Carroll Joynes, David Karraker, Morris, Fred, Wendy Norris, Diane Grams,
and Betty Farrell. New Brunswick: Rutgers UP, 2008, 194-220.
Griswold 2008 Griswold, Wendy. Regionalism and the Reading Class. Chicago: U of
Chicago Press, 2008.
Griswold and Wohl 2015 Griswold, Wendy, and
Hannah Wohl. “Evangelists of Culture: One Book Programs and
the Agents who Define Literature, Shape Tastes, and Reproduce
Regionalism”. Poetics 50 (June 2015):
96-109.
Griswold et al. 2014 Griswold, Wendy, Elizabeth
Lenaghan, and Michelle Naffziger. “Readers as
Audiences”. Handbook of Media Audiences,
ed. Virginia Nightingale. Malden, MA: Wiley Blakcwell (2014): 19-40.
Hellekson and Busse 2014 Hellekson, Karen, and
Kristina Busse, eds. The Fan Fiction Studies
Reader. Iowa City: U of Iowa Press, 2014.
Helmond 2013 Helmond, Anne. “The Algorithmization of the Hyperlink”. Computational Culture, Issue 3 (2013) http://computationalculture.net/the-algorithmization-of-the-hyperlink/
Hit Song Science Hit Song Science. https://en.wikipedia.org/wiki/Hit_Song_Science
Hungerford 2016 Hungerford, Amy. Making Literature Now. Palo Alto: Stanford UP,
2016.
Jenkins 2007 Jenkins, Henry. “Transmedia Storytelling 101”. Blog post (21 March 2007). http://henryjenkins.org/blog/2007/03/transmedia_storytelling_101.html
Jockers 2013 Jockers, Matthew L. Macroanalysis: Digital Methods and Literary History.
Urbana-Champaign: U of Illinois Press, 2013.
Kaser 2011 Kaser, James A. The
Chicago of Fiction: A Resource Guide. Lanham, MD: Scarecrow Press,
2011.
Kaufman 1990 Kaufman, Leonard, and Peter J.
Rousseeuw. “Partitioning around medoids (program
pam)”. Finding Groups in Data: An Introduction
to Cluster Analysis (1990): 68-125.
Kidd and Costano 2013 Kidd, David Comer, and
Emanuele Castano. “Reading Literary Fiction Improves Theory
of Mind”. Science 342 (18 Oct 2013):
377-80.
Kirschenbaum 2010 Kirschenbaum, Matthew, and
Adrian Johns. “Why Books? Session 1 - Storage and
Retrieval”. Radcliffe Center for Advanced Studies, Harvard
University, 28 October 2010. https://www.youtube.com/watch?v=os8No9XHjh8
Kitchin 2017 Kitchin, Rob. “The Timescape of Smart Cities”. The Programmable City Working Paper
35 (27 Nov 2017), 26.
http://progcity.maynoothuniversity.ie/
Kozlowski 2018 Kozlowski, Michael. “Global Audiobook Trends and Statistics for 2018”.
GoodEReader.com (17 Dec 2017) https://goodereader.com/blog/audiobooks/global-audiobook-trends-and-statistics-for-2018
Laquintano 2016 Laquintano, Timothy. Mass Authorship and the Rise of Self-Publishing. Iowa
City: U of Iowa, 2016.
Levey 2016 Levey, Nick. “Post-Press Literature: Self-Published Authors in the Literary
Field”. Post45 (Feb. 2013). http://post45.research.yale.edu/2016/02/post-press-literature-self-published-authors-in-the-literary-field-3/
Liu 2004 Alan Liu, The Laws of
Cool: Knowledge Work and the Culture of Information. Chicago: U of
Chicago, 2004.
Long 2003 Long, Elizabeth. Book
Clubs: Women and the Uses of Reading in Everyday Life. Chicago: U of
Chicago Press, 2003.
Lynch 2017 Lynch, Clifford. “The Rise of Reading Analytics and the Emerging Calculus of Reader Privacy
in the Digital World”. First Monday 22.4
(3 April 2017). DOI:
http://dx.doi.org/10.5210/fm.v22i4.7414.
Manovich 2013 Manovich, Lev. Software Takes Command. NY: Bloomsbury, 2013.
Mattern 2015 Mattern, Shannon. “Deep Time of Media Infrastructure”. in Lisa Parks and
Nicole Starosielski, eds. Signal Traffic: Critical Studies
of Media Infrastructures. Urbana-Champaign: U of Illinois Press,
2015, 94-112.
Mattern 2016 Mattern, Shannon. “Public In/formation”. Places
Journal (November 2016).
Mattern 2017 Mattern, Shannon. “A City Is Not a Computer”, Places
Journal (February 2017).
McGrath 2019 McGrath, Laura B. “Comping White”. Los Angeles Review
of Books (21 January 2019). https://lareviewofbooks.org/article/comping-white/
McGurl 2016 McGurl, Mark. “Everything and Less: Fiction in the Age of Amazon”. Modern Language Quarterly 77.3 (September 2016):
447-71
Mina 2019 Mina, An Xiao. Memes
to Movements: How the World’s Most Viral Media is Changing Social Protest
and Power. Boston: Beacon Press (2019).
Moore 2018 Moore, Rowan. “The
Bilbao Effect: How Frank Gehry’s Guggenheim Started a Global Craze”.
The Guardian (01 October 2017). Accessed 19 Dec
2018, and available at:
https://www.theguardian.com/artanddesign/2017/oct/01/bilbao-effect-frank-gehry-guggenheim-global-craze
Moretti 1997 Moretti, Franco. Atlas of the European Novel 1800-1900. New York:
Verso, 1997.
Mumper and Gerrig 2019 Mumper, Micah L., and
Richard J. Gerrig. “How Does Leisure Reading Affect Social
Cognitive Abilities?”
Poetics Today 40.3 (September 2019): 453-73.
NEA 2004 National Endowment for the Arts (NEA).
Reading at Risk: A Survey of Literary Reading in
America. Washington, DC: NEA, 2004.
NEA 2007 National Endowment for the Arts (NEA).
To Read or Not to Read: A Question of National
Consequence. Washington, DC: NEA, 2007.
NEA 2009 National Endowment for the Arts (NEA).
Reading on the Rise: A New Chapter in American
Literacy. Washington, DC: NEA, 2009.
NEA 2017 National Endowment for the Arts (NEA).
“2017 Survey of Public Participation in the Arts:
Reading”. Available at: https://www.arts.gov/artistic-fields/research-analysis/arts-data-profiles/arts-data-profile-18
Nakamura 2013 Nakamura, Lisa. “‘Words With Friends’: Socially Networked Reading on
Goodreads”. PMLA 128.1 (2013):
238-43.
Nunberg 2013 Nunberg, Geoffrey. “Noted”, Chronicle of Higher
Education, 7 Jan 2013.
Olmstead 2019 Olmstead, Nathan A. “Data and Temporality in the Spectral City”. Philosophy and Technology (pre-print, December 2019):
n.p. https://doi.org/10.1007/s13347-019-00381-8
Palfrey 2016 Palfrey, John. “Design Choices for Libraries in the Digital-Plus Era”. Daedalus 145.1 (Winter 2016): 79-86.
Pariser 2011 Pariser, Eli. The Filter Bubble: What the Internet is Hiding From You. NY:
Penguin, 2011.
Pera et al. 2010 Pera, Maria Soledad, Nicole Condie,
and Yiu-Kai Ng. “Personalized Book Recommendations Created
by Using Social Media Data”. In D.K.W. Chiu et al. eds. WISE: Web Information Systems Engineering 2010
Workshops, LNCS 6724, Springer, 2011, 390–403.
Pinder 2012 Pinder, Julian. “Online Literary Communities: A Case Study of Library Thing”. From Codex to Hypertext: Reading at the Turn of the
Twenty-First Century, ed. Anouk Lang. Amherst: U of Massachusetts
Press, 2012, 68-87.
Piper and Portelance 2016 Piper, Andrew, and Eva
Portelance. “How Cultural Capital Works: Prizewinning
Novels, Bestsellers, and the Time of Reading”. Post45 (10 May 2016).http://post45.research.yale.edu/2016/05/how-cultural-capital-works-prizewinning-novels-bestsellers-and-the-time-of-reading/
Porter 2018 Porter, J.D. “Popularity/Prestige”. Stanford Literary Lab Pamphlet 17 (September
2018). https://litlab.stanford.edu/LiteraryLabPamphlet17.pdf
Putnam and Feldstein 2003 Putnam, Robert D., and
Lewis M. Feldstein, with Dan Cohen: Better Together:
Restoring the American Community. New York: Simon and Schuster,
2003.
Radway 1997 Radway, Janice. A
Feeling for Books: The Book-of-the-Month Club, Literary Taste, and
Middle-Class Desire. Chapel Hill: U of North Carolina Press, 1997.
Risley 2015 Risley, James. “Seattle
Public Library's Free WiFi Hotspot Program Receives Its Funding, 450 More Devices.”
GeekWire.com (2 December 2015).
Rodriquez et al. 2012 Rodriquez, Kepa Joseba,
Mike Bryant, Tobias Blanke, and Magdalena Luszczynska. “Comparison of Named Entity Recognition Tools for Raw OCR Text”.
Proceedings of KONVENS 2012: 410-414. http://www.oegai.at/konvens2012/proceedings/60_rodriquez12w/60_rodriquez12w.pdf
Rooney 2005 Rooney, Kathleen. Reading With Oprah: The Book Club That Changed America.
Fayetteville: U of Arkansas Press, 2005.
Rosen 2018 Rosen, Jeremy. “Literary Fiction and the Genres of Genre Fiction”. Post45 (August 2018) http://post45.research.yale.edu/2018/08/literary-fiction-and-the-genres-of-genre-fiction/
Rubery 2016 Rubery, Matthew. The Untold Story of the Talking Book. Cambridge: Harvard UP,
2016.
Sampson 2012 Sampson, Robert J. Great American City: Chicago and the Enduring Neighborhood
Effect. Chicago: U of Chicago Press, 2012.
Schnapp and Battles 2014 Schnapp, Jeffrey T., and
Matthew Battles. The Library Beyond the Book.
Cambridge: Harvard UP, 2014.
Shirky 2005 Shirky, Clay. “Ontology is Overrated: Categories, Links, and Tags”. Available at:
http://shirky.com/writings/herecomeseverybody/ontology_overrated.html#parable_of_the_ontologist
Singer and Brooking 2018 P.W. Singer and Emerson
T. Brooking. LikeWar: The Weaponization of Social
Media. NY: Houghton Mifflin, 2018.
Sinykin 2017 Sinykin, Dan N. “The Conglomerate Era: Publishing, Authorship, and Literary Form,
1965-2007”. Contemporary Literature 58.4
(2017): 462-90.
Stanford Literary Lab 2016 Stanford Literary Lab.
“Mapping London’s Emotions”. New Left Review (Sept/Oct 2016): 63-91.
Striphas 2009 Striphas, Ted. The Late Age of Print: Everyday Book Culture from Consumerism
to Control. New York: Columbia UP, 2009.
Taylor 2012 Taylor, Joan Bessman. “Producing Meaning Through Interaction: Book Groups and the
Social Context of Reading”. in Anouk Lang, ed. From Codex to Hypertext: Reading at the Turn of the Twenty-First
Century. Amherst: U of Massachusetts Press, 2012, 142-58.
Thomas 2011 Thomas, Bronwen. “What
is Fanfiction and Why Are People Saying Such Nice Things About It?” StoryWorlds:
A Journal of Narrative Studies 3 (2011): 1-24.
Tufekci 2017 Tufekci, Zeynep. Twitter and Teargas: The Ecstatic, Fragile Politics of
Networked Protest in the 21st Century. New Haven: Yale UP,
2017.
Vadde 2017 Vadde, Aarthi. “Amateur Creativity: Contemporary Literature and the Digital Publishing
Scene”. New Literary History 48 (2017):
27-51.
Vlieghe et al. 2016 Vlieghe, Joachim, Jal Muls,
and Kris Rutten. “Everybody Reads: Reader Engagement with
Literature in Social Media Environments”. Poetics 54 (2016): 25-37.
Weber 2016 Weber, Marc. “Self-Fulfilling History: How Narrative Shapes Preservation of the Online
World”. Information & Culture 51.1
(2016): 54-80.
Weinberger 2012 Weinberger, David. “Library As Platform”. Library
Journal, 4 Sep 2012.
Wilkens 2016 Wilkens, Matthew. “Genre, Computation, and the Varieties of Twentieth-Century
U.S. Fiction”. CA: Journal of Cultural
Analytics (Nov. 1, 2016). DOI:
10.31235/osf.io/e7wy6.

URL: http://www.digitalhumanities.org/dhq/vol/14/2/000461/000461.html
Comments: dhqinfo@digitalhumanities.org
Published by: The Alliance of Digital Humanities Organizations and The Association for Computers and the Humanities
Affiliated with: Digital Scholarship in the Humanities
DHQ has been made possible in part by the National Endowment for the Humanities.
Copyright © 2005 -

Unless otherwise noted, the DHQ web site and all DHQ published content are published under a Creative Commons Attribution-NoDerivatives 4.0 International License. Individual articles may carry a more permissive license, as described in the footer for the individual article, and in the article’s metadata.
Comments: dhqinfo@digitalhumanities.org
Published by: The Alliance of Digital Humanities Organizations and The Association for Computers and the Humanities
Affiliated with: Digital Scholarship in the Humanities
DHQ has been made possible in part by the National Endowment for the Humanities.
Copyright © 2005 -
Unless otherwise noted, the DHQ web site and all DHQ published content are published under a Creative Commons Attribution-NoDerivatives 4.0 International License. Individual articles may carry a more permissive license, as described in the footer for the individual article, and in the article’s metadata.
