Abstract
We present our use of the FSA-OWI Photographic Archive, a collection of over 170,000
photographs taken by the US Government between 1935 and 1945, within Photogrammar as a case study of how to integrate methodological research into a
digital, public project. Our work on the collection uses computational methods to extract
new metadata surrounding individual photographs from the perspective of both the
photographers and the original government archivists. Techniques for accomplishing this
include mapping over an historical atlas, recreating historic cataloging systems, and
digitally stitching together rolls of film. While many digital projects have focused on
analysis at scale, our work on extracting new metadata actively demonstrates the power of
digital techniques to assist in the close reading of even small sets of archival records.
We conclude the article by describing how these contributions are presented in the Photogrammar site and describing the forms of collaboration needed
to produce the final project.
1. Overview
The Farm Security Administration - Office of War Information archive is a collection of
over 170,000 monochrome and color photographs, commissioned between 1935 and 1945 by the
United States federal government. The collection originated in 1935 as a publicity
campaign for the Resettlement Administration, one of President Franklin Roosevelt’s Second
New Deal projects centered on aid to migrants from the drought stricken southwest. By the
late 1930s, the collection was moved to the Farm Security Administration and had grown
into a massive documentary photography project with aspirations to document the entire
United States. Known as the Historic Division, this division of photographers led by Roy
Stryker was finally transferred to the Office of War Information in 1942 to serve
government interests in World War II. Offering a unique snapshot of the nation during the
period, the archive serves as an important visual record for scholars and the
public-at-large. Additionally, the photographers and administrators involved with the
FSA-OWI collection have been the subject of extensive academic scholarship around how they
shaped America’s documentary record and documentary photography [
Hurley 1972]
[
Cohen 2009]
[
Stott 1973]
[
Mendelson 2003]
[
Mora 2006].
Following World War II, the collection was transferred to The Library of Congress for
cataloging. The Library of Congress chose the collection to experiment with digitization
and digitized the entire collection in the 1990s. With changes in technology and new
digital standards, they are in the process of re-digitizing the collection to current
archival standards.
[1] Since the photographs were taken on behalf of the United
States Government, access to and use of the collection is essentially free and open. Given
that it is a public resource, the Prints and Photographs Division of the Library of
Congress has hosted archival quality scans of every photograph in the collection on their
public website.
Extensive metadata accompany a majority of the photographs, capturing features such as
dates, titles, locations, photographers’ names, and a unique identifying call number.
Basic text search features are provided, but otherwise the website is presented as a
digital reproduction of the physical archive with a limited set of digital-only
features.
While the existing interface allows for browsing access to the archived material, we
understood that more direct access to the data would be necessary in order to analyze the
records computationally. Neither an API nor a single downloadable website snapshot was
provided by the Library of Congress. Given the clean structure of the Library of Congress
website and copyright status of the FSA-OWI collection, creating a local copy of the
archive via a custom webcrawler proved relatively straightforward. The complete
code and documentation
for this process are publicly available. Prior to working with the downloaded data, we
cleaned the data in order to standardize each field. For instance, dates were written in a
number of styles (“Aug 1943”, “Aug. 1943”,
“August 1943”, “Summer 1943”) and needed to be
transformed on a case by case basis into a common format. Other fields, such as
photographer names and captions, had similar issues. County, city, and state names were
particularly messy and required using a
web-based
geocoding service.
Once organized in a single local database, the FSA-OWI collection could be viewed in
aggregate. The ability to filter and tabulate by various parameters provided new insight
into the collection's scope. For example, creating a table showing the number of images
taken by each photographer showed how relatively few photographs some of the more
well-known staff photographers took (Walker Evans was only the 20th most populated) and
exposed the extensive number of contributing photographers (over 54 have at least 50
photographs in the collection, and over 133 were credited overall). Creating a table of
photographs per state revealed that no fewer than 123 photographs (Rhode Island) were
taken in each of the then extant 48 states. Viewing by country revealed hundreds of
photographs from overseas, including North Africa and the Caribbean.
In addition to aggregate counts, having the archive in a local database also enabled the
application of digital humanities methods to close read the collection, with a focus on
spatial and computational analysis. Often, computational analysis is applied to study an
archive at scale. Scholars such as Franco Moretti [
Moretti 2005] and Matthew
Jockers [
Jockers 2013] have pioneered and refined this approach. However,
computational analysis can also enable close reading, a fundamental aspect of humanities
scholarship [
Abello, Broadwell, and Tangherlini 2012]. This is important because often skepticism
regarding the field of digital humanities centers around concerns that close reading is
compromised through computational methods, a false dichotomy problematized and addressed
by Michael Hacher [
Hancher 2016]. The methods applied to the FSA-OWI archive
as explored in this article show how computational methods can play a critical role in
close analysis of sources and further humanities scholarship.
Our computational analysis led to three major components of Photogrammar. As with the aggregate tabulations, spatial representation
(mapping) of the archive helped distill the general patterns of what, where, and when the
photographers were documenting. Mapping also provides information local to individual
entities in the collection, thus assisting scholars interested only in a close reading of
those particular photographs. After realizing that mapping could assist in the study of
the FSA-OWI collection at a variety of scales, we sifted through our local copy of the
archival database and discovered several additional latent features in the photographs and
metadata. For example, we were able to impute the historic hierarchical archival developed
in the 1940s by Paul Vanderbilt and we were also able to reconstruct strips of 35mm film
used by FSA-OWI photographers. These three methods for uncovering latent metadata in the
FSA-OWI collection are described in detail in the remainder of this article, with a focus
on the kinds of contextual depth they add to understanding individual records within the
archive as well as in the aggregate.
2. Mapping
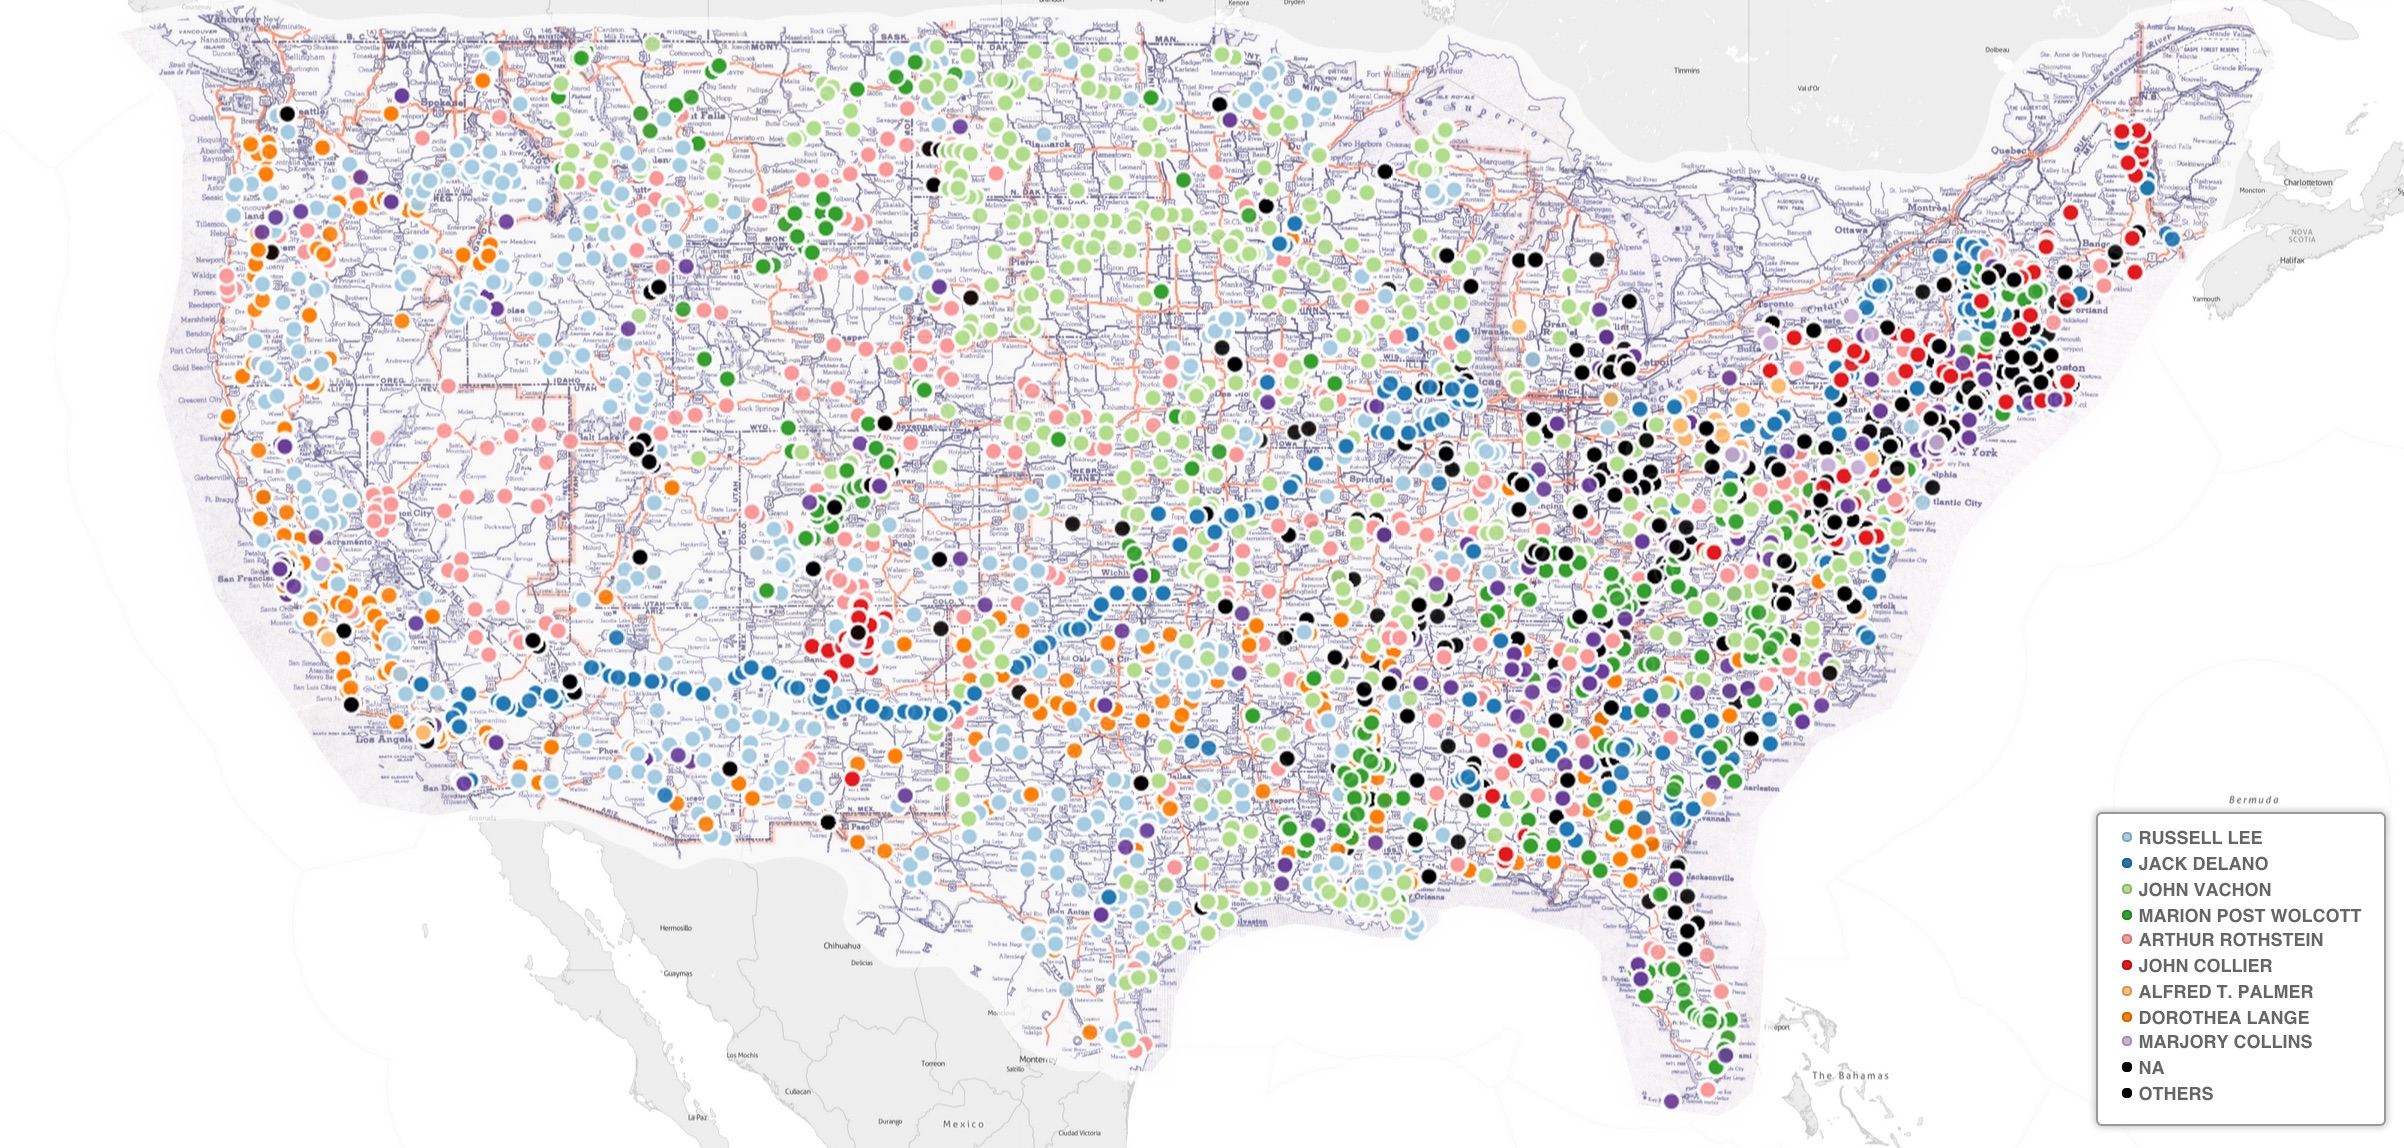
Just over half of the photographs in the digital FSA-OWI collection are tagged with some
level of geographic information. In some cases this was as detailed as the name of a
particular street in a large city. The majority, however, were referenced at the county or
city level. Using a geocoding service, along with some careful tweaks to adjust for
changes in historical county borders, we tagged the photographs with latitude and
longitude coordinates. Plotting these over a modern map obfuscates the routes staff
photographers traveled in the 1930s and 1940s because many of the modern-day highways are
part of the Interstate Highway System, which was constructed in the latter half of the
20th century. Instead, the photograph locations were mapped over a Vico Motor Oil Map from
1937 (
Figure 1) . Beyond looking at the collection at scale,
there is a wealth of information that can be learned and questions that can be posed about
each photograph or sequence of photographs by putting them in geographical context.
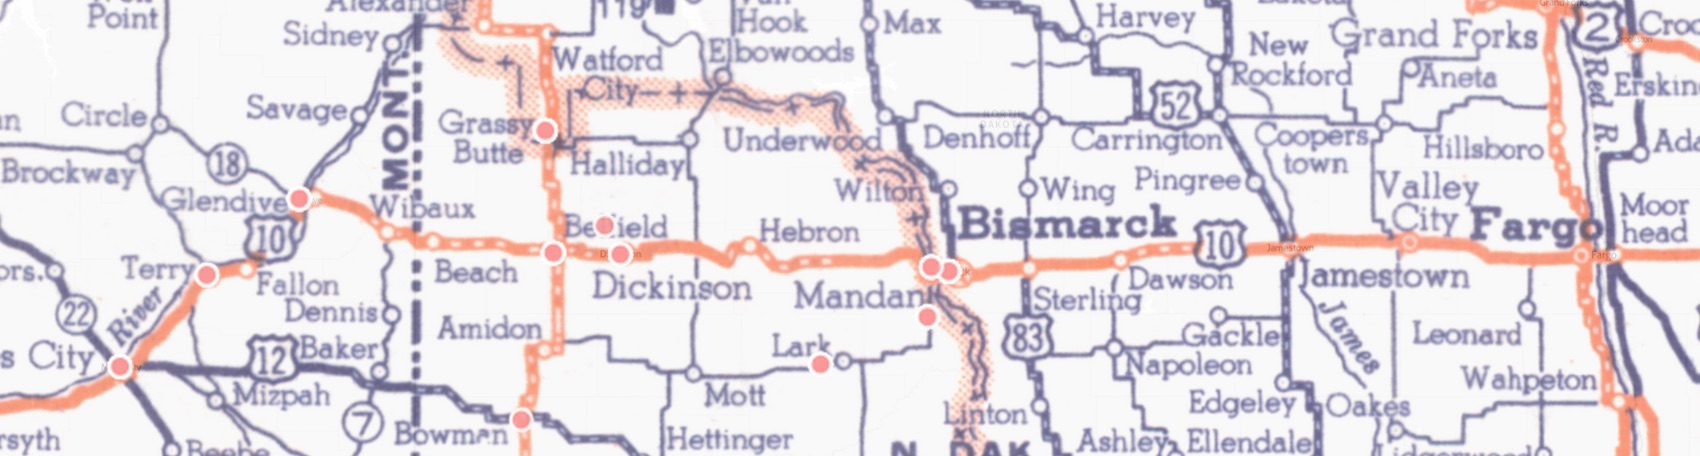
For example, mapping all of Arthur Rothstein's photographs taken over the course of the
summer of 1936 show that he was driving along major roads, primarily Route 10, between
Washington State and Minneapolis-Saint Paul (
Figure 2). The
same map also highlights an outlier, as indicated by the pink dot near the town of Lark.
Upon closer inspection, the photos are near the neighboring town of Carson, which is nine
miles southwest of Lark. This observation is interesting because Rothstein needed to
travel several hours out of his way in comparatively rural counties, something he did not
appear to do elsewhere along his two-and-a-half month trek across Washington, Idaho, North
Dakota, and Minnesota. As a result, one questions why he deviated from the main highway at
this particular moment. Looking even closer, the photographs themselves begin to offer
answers. The photographs near Carson are a sequence of five photographs of Mike Sullinger
and his drought-ridden farm in July 1936. Here Rothstein finds a set of conditions to
communicate the impact of the drought on farming and an individual farmer. By mapping a
sizable set of the archive to discern Rothstein's route across the Northwestern US, we
have been provided useful contextual information regarding a small sequence of five
photographs.
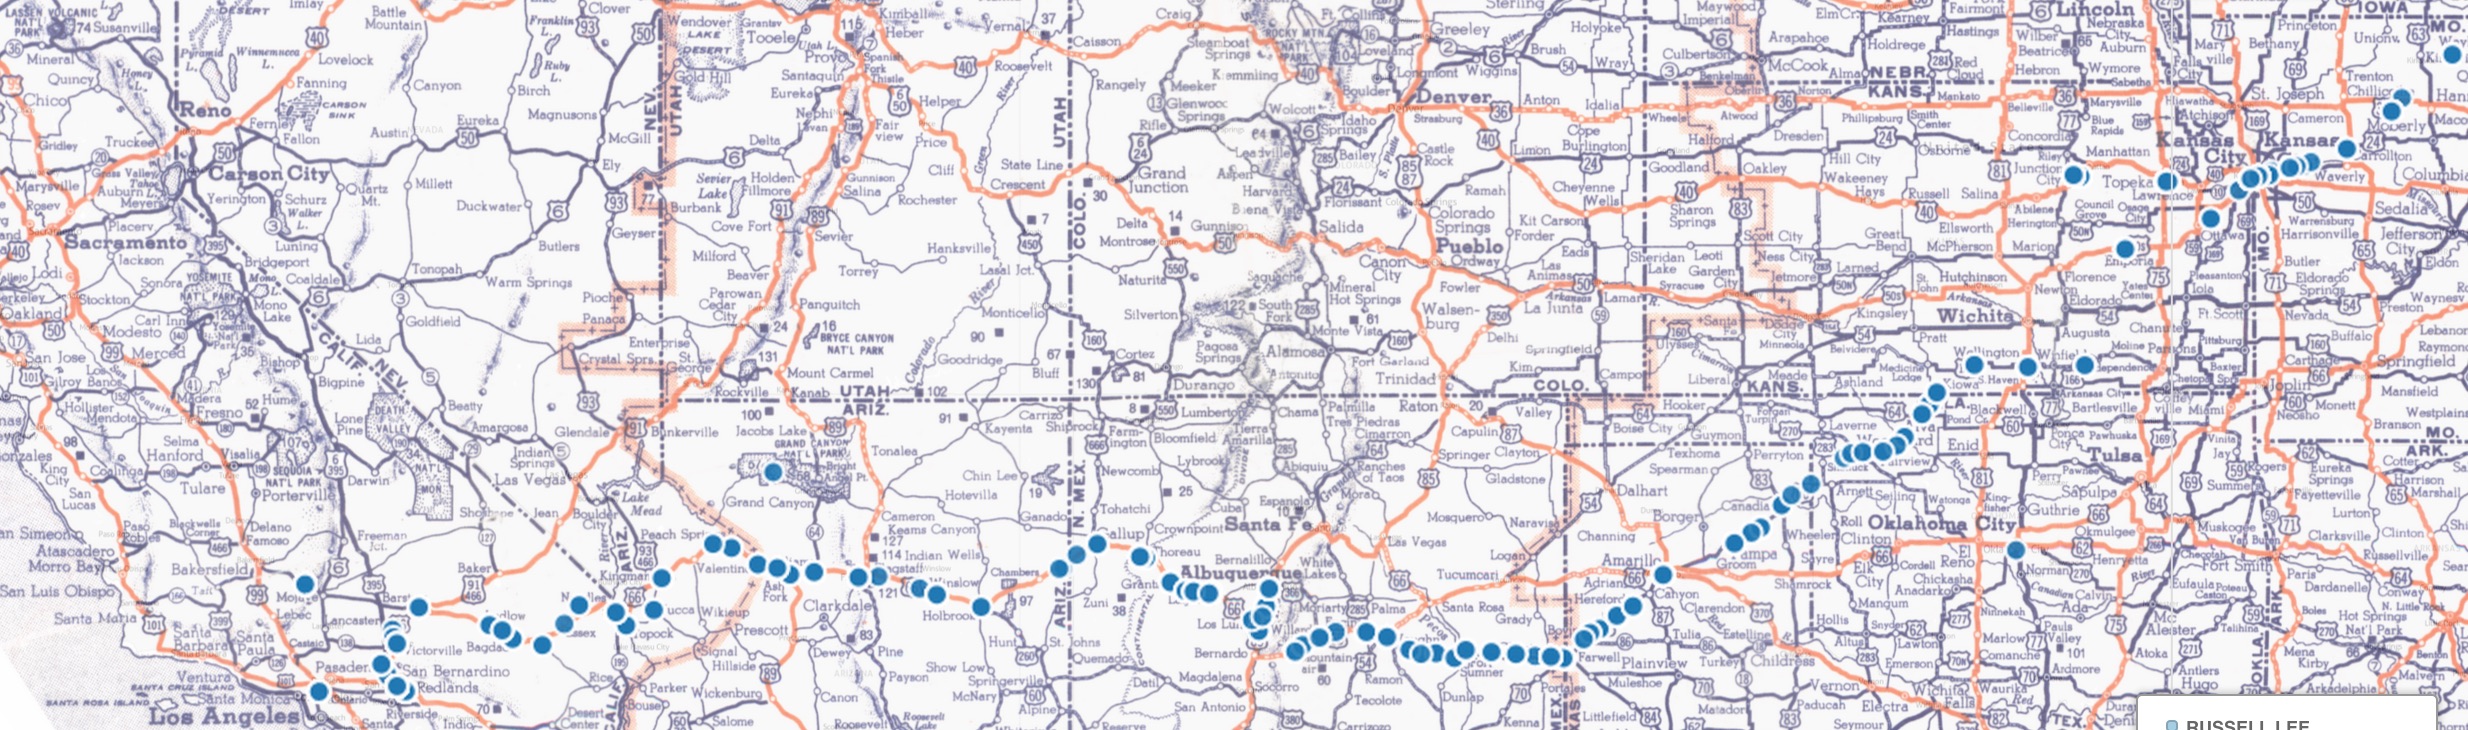
Jack Delano also offers another example for the impact of mapping on close reading
images. A significantly longer sequence of photographs is shown below, when Jack Delano
traveled between Chicago, Illinois and Los Angeles by rail (
Figure
3). Since this trip was completed entirely within the month of March of 1943, and
dates in the collection were only recorded by month and year, it was not possible to order
Delano's photographs from start to finish along this route without using a map. In turn,
mapping allows the viewer to key the photographs to the map and see the order in which the
photographs were taken. Such insight allow for a closer analysis of Delano's shooting
process.
3. Vanderbilt system
Paul Vanderbilt joined the FSA office in 1942. Under the direction of Roy Stryker,
Vanderbilt developed two pioneering archival systems for cataloging the photographic
prints produced by the photographic division: a classification system and a lot
system.
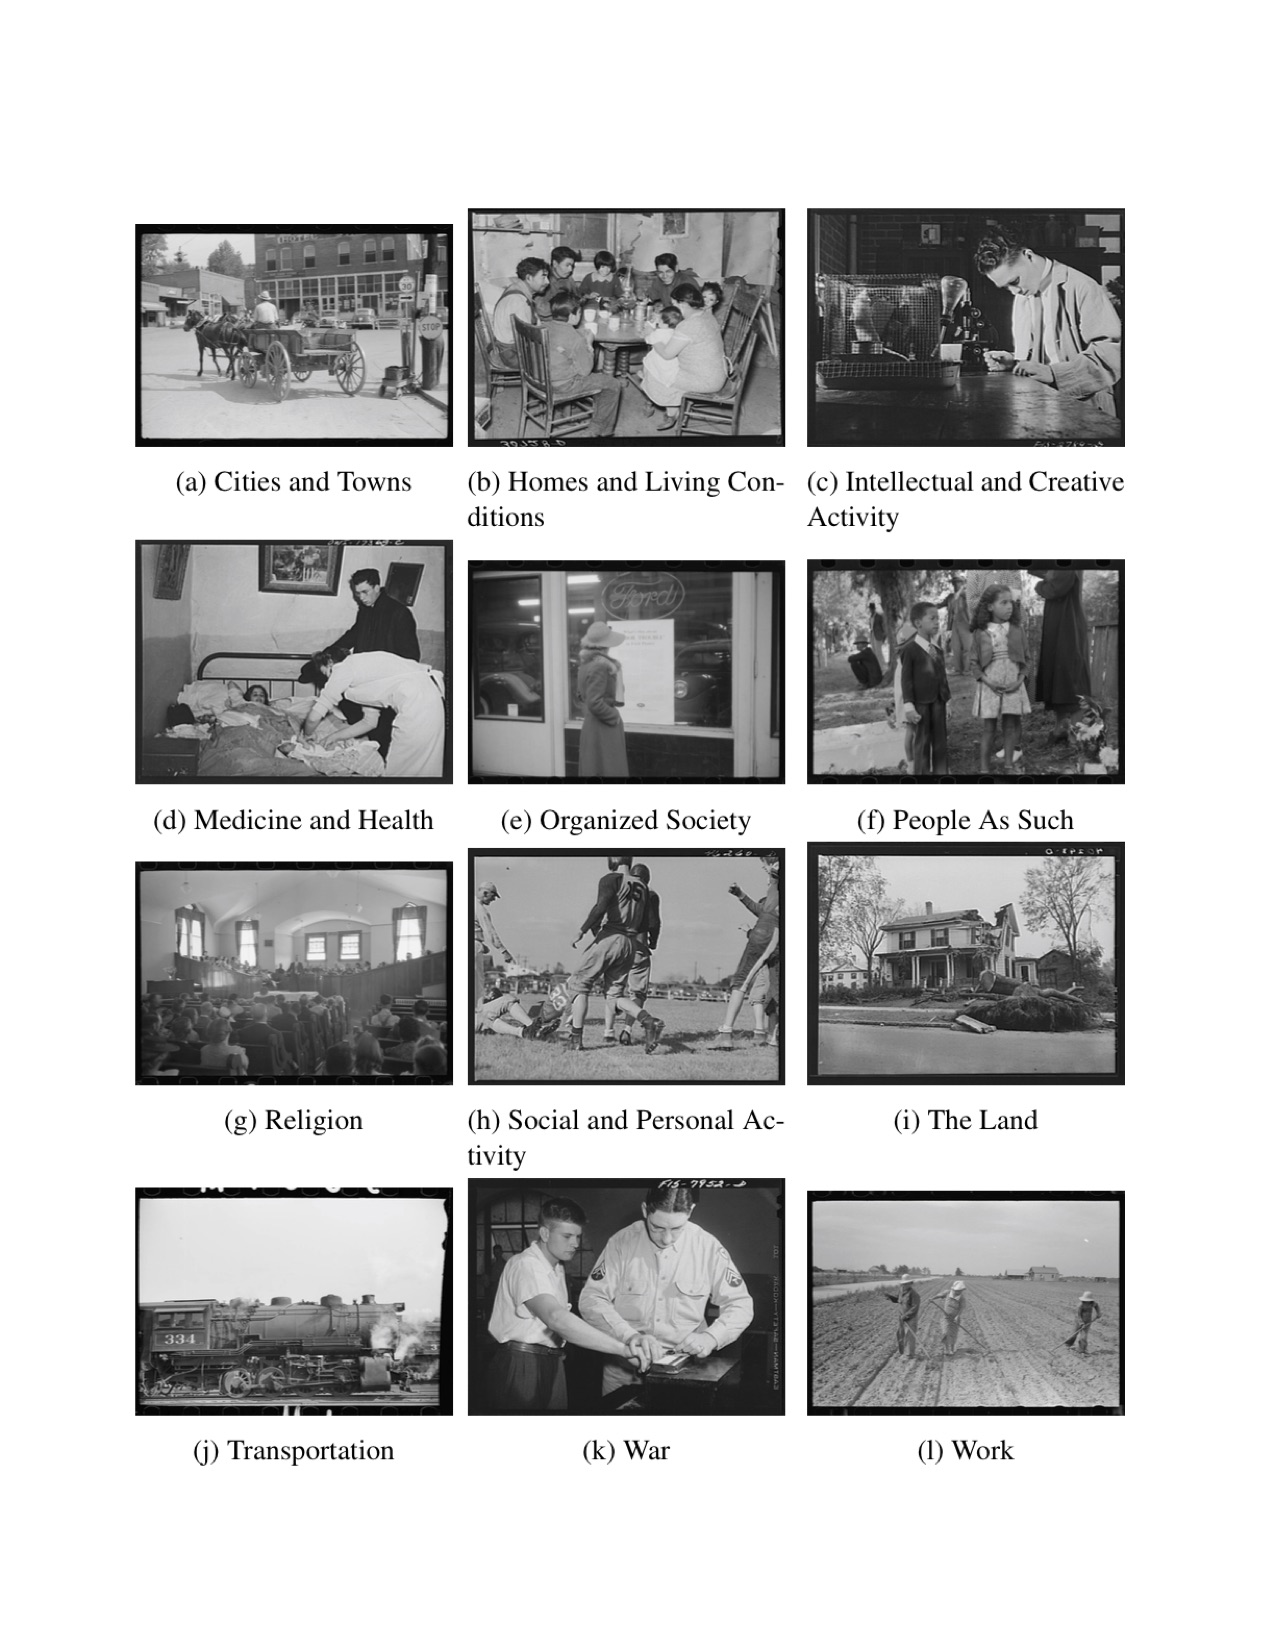
For the classification system, he first split approximately 88,000 photographs into five
geographic regions based on where they were shot. They were then assigned to a three-tier
hierarchy based on the photograph's themes or subjects, a process today that one might
refer to as tagging. The first level included 12 main subjects: The Land, Town and Cities,
People, Homes and Living Conditions, Transports, Work, War, Medicine and Health, Religion,
Intellectual and Creative Activity, Social and Personal Activity. The table of images
below shows samples from each of the categories (
Figure 4).
After being assigned to a main subject, each photograph was then assigned to one of 50
sub-headings and then again assigned to one of approximately 1300 sub-sub-headings. The
resulting system persists today as the method for organizing the photographic prints at
the Library of Congress. Vanderbilt's hierarchical scheme and methodology for classifying
photographs has been the subject of research in its own right [
Trachtenberg 1988].
The Vanderbilt classification system tags are not overtly discernible from the metadata
in the digitized archive. However, it is possible to reconstruct them using the available
metadata fields. The unassuming field “Other Number” contains cryptic
codes such as “D 915”, which represent the Vanderbilt categorization of
the record. The only known mapping between these codes and the categories is a printed
manual from 1981 [
United States 1981]. Therefore, populating the local database of the
archive with the classification system required obtaining this manual, creating a digital
scan of the codes, running an OCR detector over the scans, and joining the resulting codes
to the “Other Number” field.
Digitally reconstructing the categorization scheme greatly simplified the process of
analyzing Vanderbilt's cataloging project. It was previously possible only when visiting
the physical FSA-OWI archive and required substantial effort to look at several categories
at once.
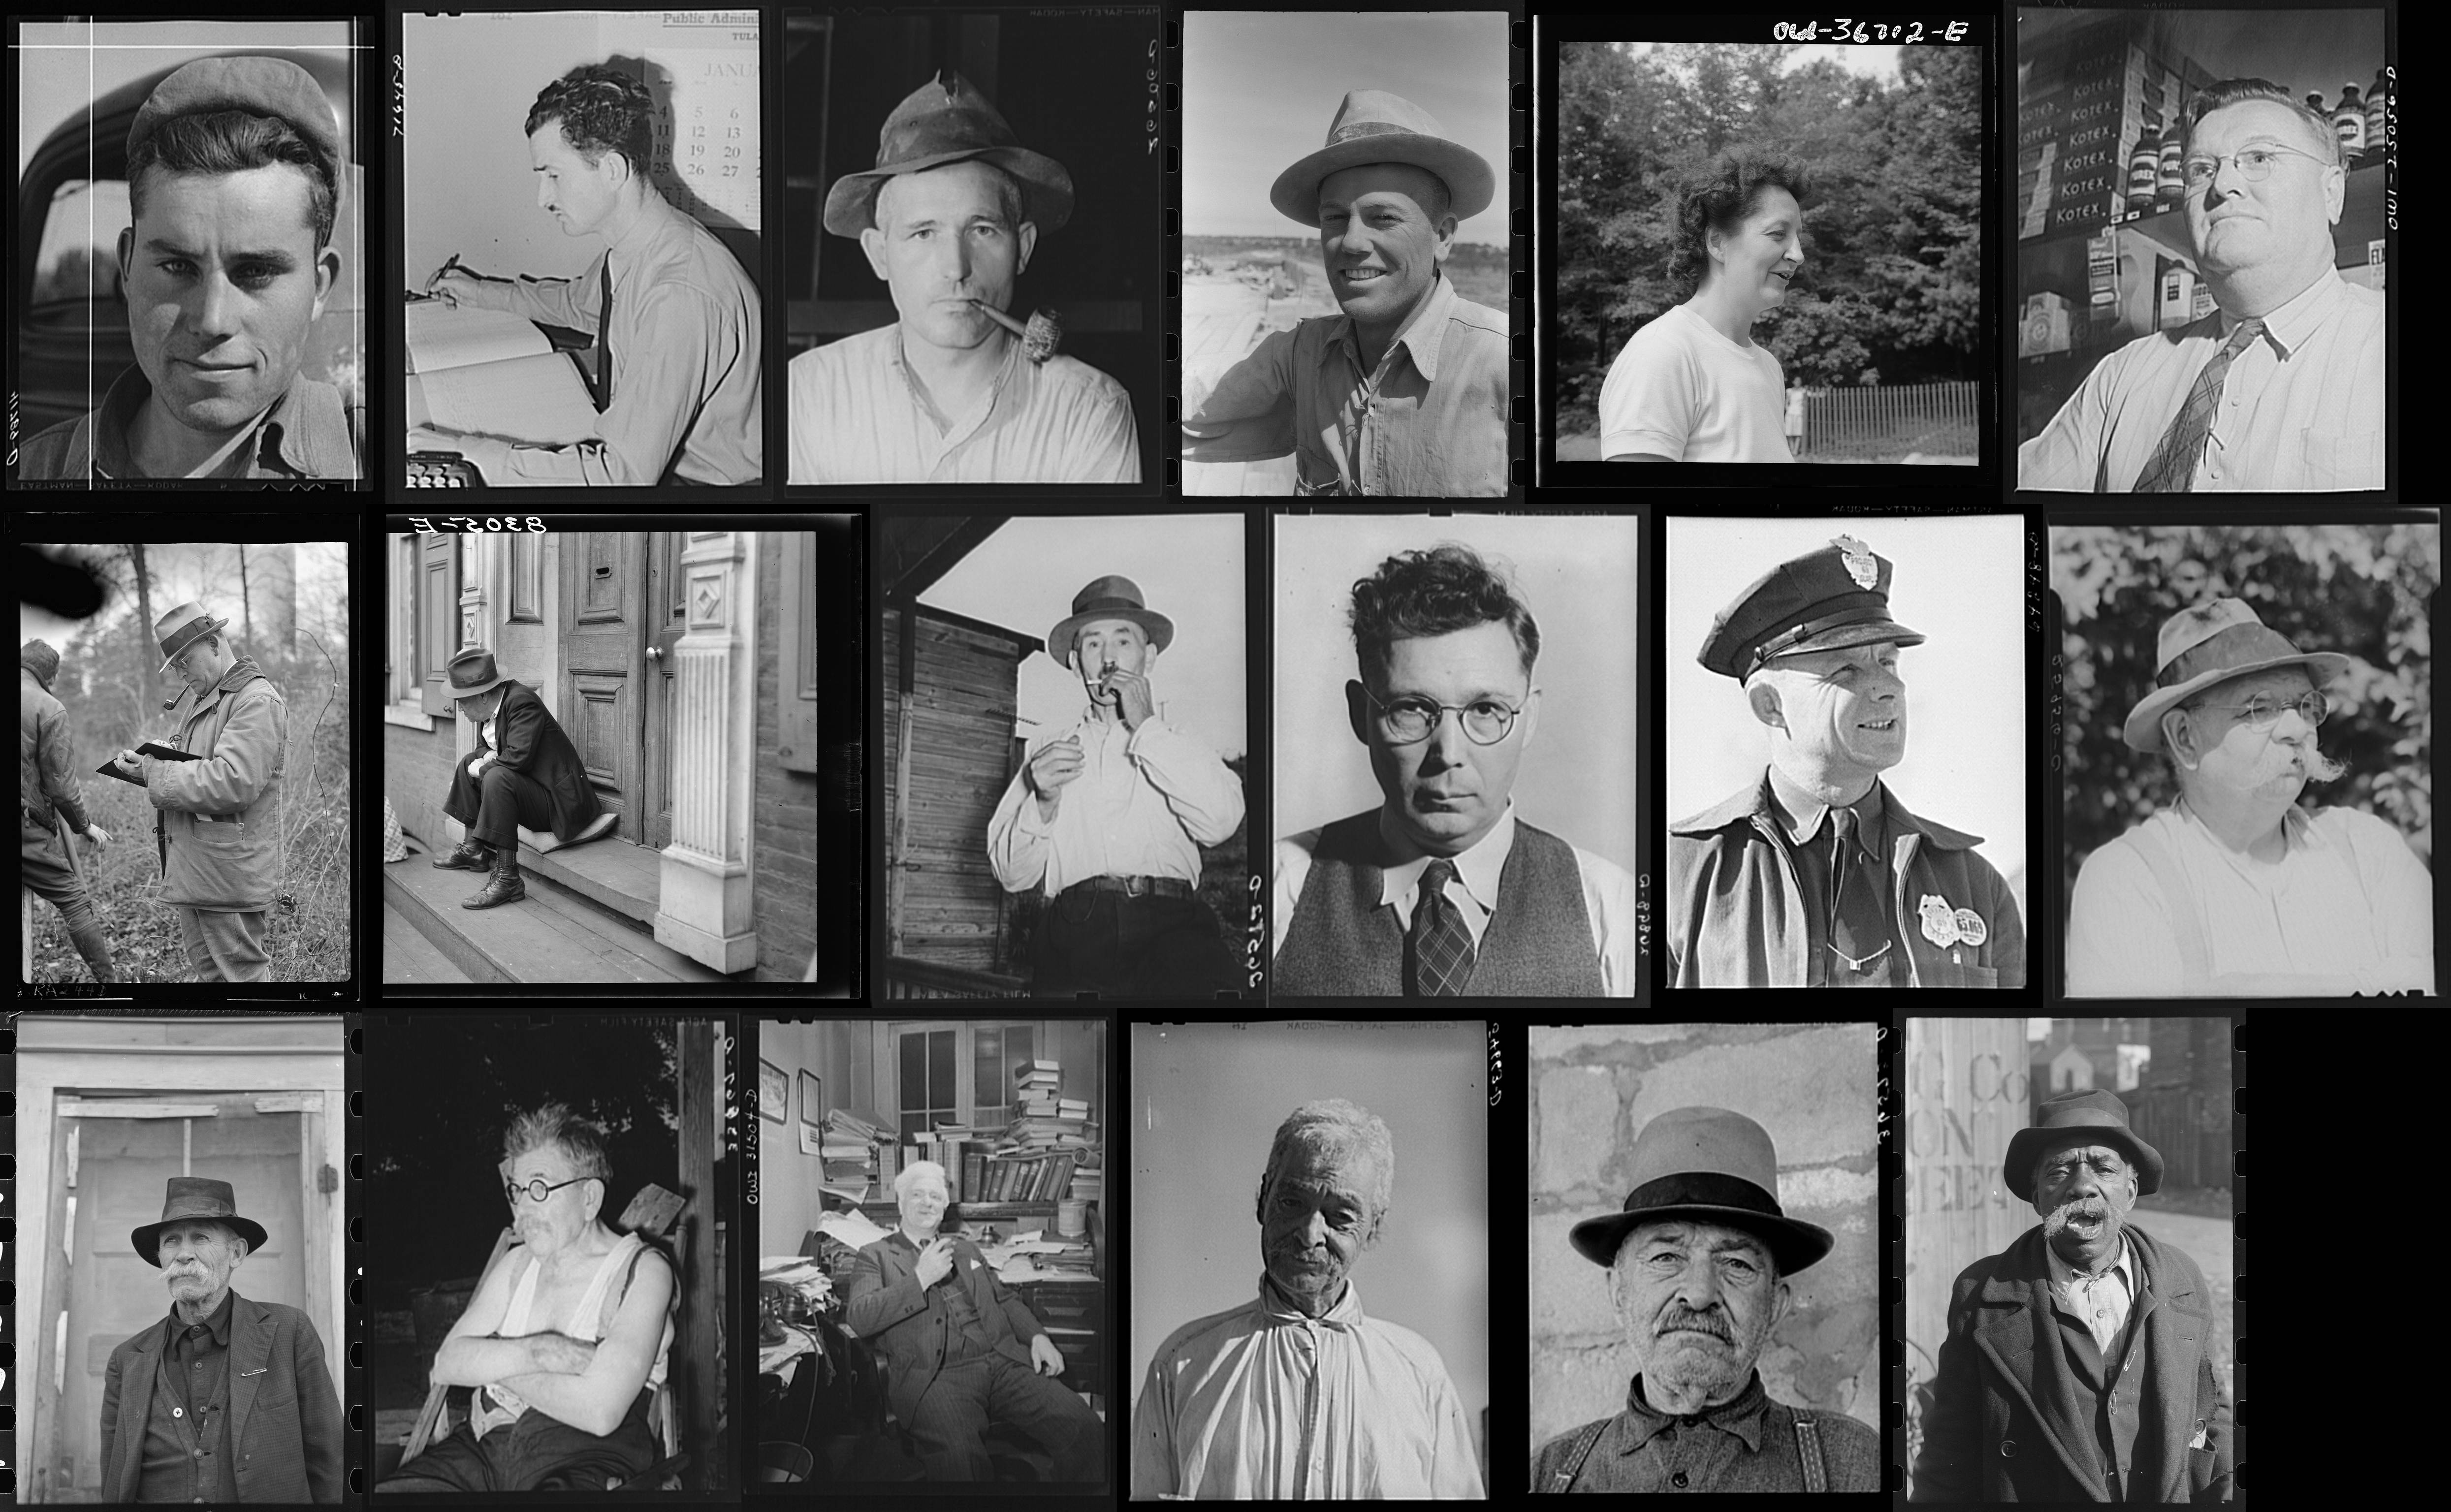
Figure 5 shows an example of the kind of
visualizations that can now be quickly constructed. All of the photos shown here were
placed into the “People As Such” top level and “Groups and
Individuals” second level categories. The first row was placed into the
tertiary category “Men in Their Prime”, the second as “Middle
Aged Men”, and the third as “Old Men”. Displayed as such,
these sub-categories illustrate that the process of tagging photographs reflects
subjective differences of interpretation. The caption of the second to last photograph on
the first row, for example, indicates that this is in fact a photograph of Mrs. Janet P.
Murray.
While the classification system offers one way to tag and read the archive, the lot
system offers a different point of entry based on another piece of latent data, which
resides in the MARC field “Notes”. Lots, also a creation of Paul
Vanderbilt, were an organizing mechanism to provide a different way of accessing the
collection. In this case, the photographs were put into a lot primarily based on a
shooting assignment. Often a photographer would visit the same place more than once. For
example, Lot 4 includes 124 photographs by Russell Lee in Salinas, California taken at
multiple times between December 1941 and December 1942.
Surfacing and making visible the Vanderbilt system has given users digital access to the
collection through the archival system developed in the 1940s. Vanderbilt's two systems
are not only an exciting way to close read a subset of the archive but serve as an object
of study themselves. The very categories that make up the schema reflect the type of
knowledge the federal government believed it was collecting. Naming the subject of a
photograph is a complicated negotiation that is often as much a reflection of the
categorizer and time period as the image itself. As a result, the Vanderbilt system itself
offers a way to close read the archive.
4. Strips
The large number of printed photographs of the FSA-OWI collection displayed in long
filing cabinets at the Library of Congress is actually only a limited subset of the images
in the digital archive. The Library of Congress also retained a larger set of the
negatives; it was these that were carefully digitized and placed online.
[2] While some negatives are from various large format
cameras, the majority come from long rolls of 35mm film. When 35mm film was processed in
Washington D.C., the FSA-OWI staff would cut the film into strips of 4-6 frames in order
to facilitate the process of curating and printing the images. Conveniently, this film
structure is hidden as the suffix in the “Reproduction Number” field
associated with each image in the digital collection. For instance, the negative
associated with the number LC-USF33-016166-M2 is on a single strip of 35mm file between
LC-USF33-016166-M1 and LC-USF33-016166-M3.
From our local copy of the archive, it was a straightforward process to reconstruct the
strips of film from these Reproduction numbers and to expose additional latent
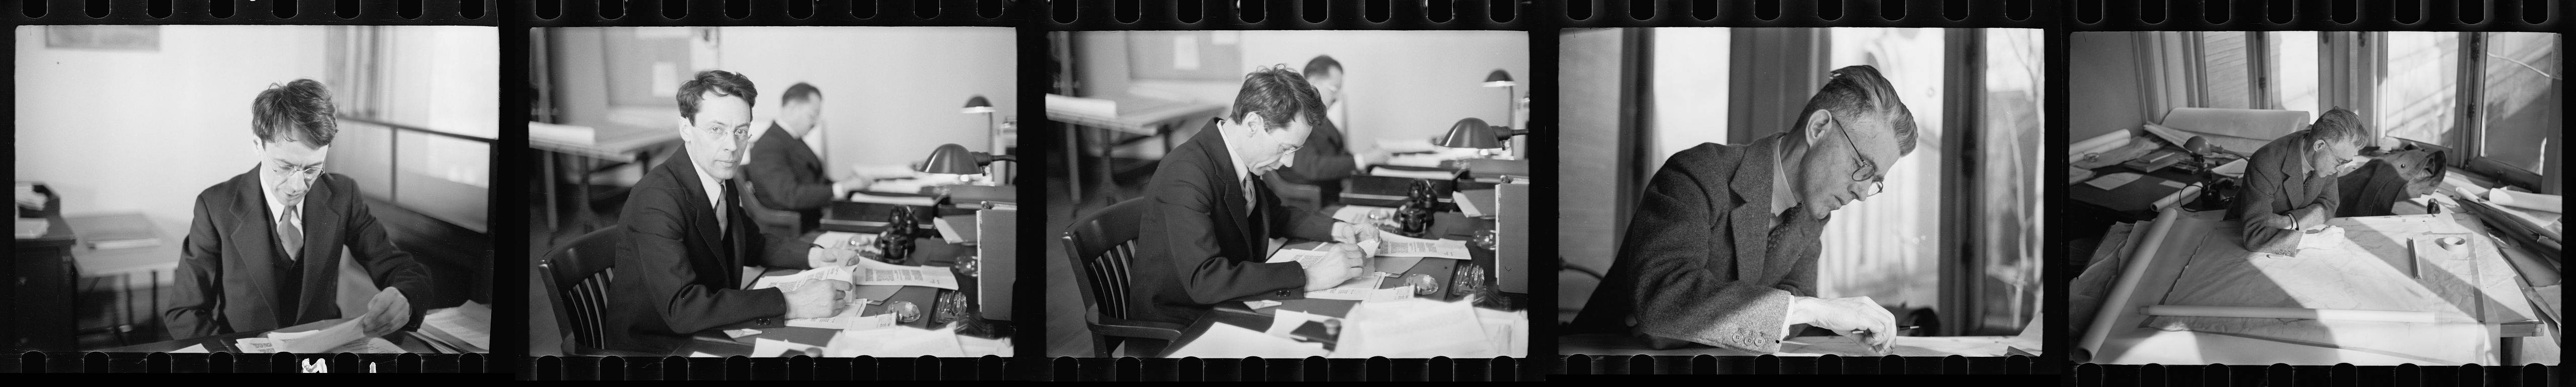
information. For example, take the reconstructed strip of film in
Figure 6. In this particular strip, the middle frame is attributed to Carl
Mydans, from February 1936, with the caption “Elbert Peets, Washington, D.C., Principal
Town Planner, Milwaukee project, Suburban Resettlement Division”. There is no
assigned photographer name, date, location, or caption to the four remaining images. Using
just the latent data from the reproduction number and assuming that film was not passed
between photographers, we can confidently attribute all five images to Carl Mydans. It is
also reasonable to make an educated guess that all five photographs were also taken around
February 1936, even though it is physically possible that the first two were taken before
and the last were taken after this date. These attributes can be filled in
algorithmically, allowing for scholars studying Carl Mydans in 1936 to locate all five
photographs, rather than just the middle photograph. Because most of the archive's
metadata comes from the physical prints rather than the negatives, over 65% of the 35mm
images in the digitized collection contain no photographer names, locations, or dates.
Using the Reproduction Numbers this count can be reduced by over half to only 31% without
any photographer information.
In addition to filling in missing metadata fields, there is even more that can be gained
from arranging the negatives as film strips. By actually investigating the photos in
Figure 6, it becomes apparent that the first three images are
in fact images of the same person. The one extant caption provides valuable information;
this individual is Elbert Peet and he holds the position of Principal Town Planner. We
also are able to put together the sequence of photographs and thus gain insight into the
photographer's ways of seeing. Finally, having the sequence together allows for insight
into what Roy Striker, who typically decided which photographs to print, was looking to
find in the images, because we know that he choose to print the last image of Elbert Peets
rather than the the first two. It should be noted that it would have been difficult to
make this connection based purely on digital methods and requires closely looking at the
records, yet at the same time, it would be incredibly difficult without digital
methods.
Figure 7 shows an example of going further by putting
individual strips of film together in order to start reconstructing an entire roll of
film. Using computational methods, we were able to pull out the first two rows of film as
possibly being sequential as they both contained photographs by John Vachon
taken in July, 1941 in Kenosha County, Wisconsin. The second and third rows similarly
contained images taken by Vachon that month from Chicago, Illinois. Once these three film
strips were pulled out from the thousands of possible film strips, a close reading of the
images revealed that the cheese shop in the top right corner is the same shop shown in the
left middle pane, and the man sitting on the sidewalk at the end of the middle row is the
same person shown at the start of the third row. As with the Mydans set, this
reconstruction of the film adds contextual information regarding decisions by both the
photographer and the archivists. The order of the photographs reveals additional latent
information; it is now clear that Vachon traveled from Wisconsin and into Chicago, which
was not discernible otherwise because the metadata for the photographs includes only month
and year. John Vachon went on to take hundreds of photos in Chicago, depicting it
primarily as a prosperous city. It is very interesting to be able to put the store fronts
and bustling movie theaters in those photographs into perspective after knowing that the
first scene he choose to capture of the city was a man slouched over, sitting on his
suitcase by the side of the road. One can begin to ask questions about Vachon’s
juxtaposition of scarcity and abundance in an American city.
5. Building Photogrammar
The three examples addressed show where large-scale digital methods have uncovered
contextual latent metadata and how this new information can assist scholars in close
reading a subset of records. Excited about the possibilities of these methods, we felt
that it important to provide a user-friendly platform for exploring the collection to a
broader set of publics. A digital, public humanities project, Photogrammar provides such a space. It was built in consideration of other
popular enhanced digital archives, including Library of Congress’s American Memory,
University of Richmond’s Visualizing Emancipation, and HistoryPin. We have borrowed
insights from these projects in an attempt to meet the needs of casual users broadly
interested in 20th Century American history and photography alongside research scholars
who may have been studying this specific collection for decades.
In order to build the
Photogrammar
website, an interdisciplinary team,
including the present authors and Ken Panko, was funded by an NEH Digital Start-Up Grant.
The size and scope of the collection made it extremely difficult to navigate without deep
subject matter expertise across a number of disciplines. For example, it would have been
difficult to discern the latent data sitting within the archive without specialists in
data analysis alongside experts with an intimate understanding of the FSA-OWI collection.
Drawing on disparate and complementary expertise, our interdisciplinary core team included
a GIS specialist, instructional technologist, statistician and two historians.
In order to manage expectations and goals, we created a series of phases. After three
years of work, including several week-long trips to the Library of Congress, we publicly
launched the first iteration of the site in May 2014. This phase included launching Photogrammar with advanced search features, historical interactive
maps, and a dynamic visualization of Vanderbilt's historic cataloging system. Additional
features are in process in order to interact with an increasingly wider set of publics,
including journalists, artists and K-12 students, and to further assist in active
scholarship surrounding then collection and the historical era it documents. Made possible
with support from ACLS, our current phase integrates interviews by the FSA-OWI staff
photographers from the Smithsonian Archives of American Art, digitizes texts from the
Federal Writer's project, and builds a public interface for the film strips. As we move
forward, collaboration has served as a guiding principle and allowed the project to
flourish in exciting directions.
Works Cited
Abello, Broadwell, and Tangherlini 2012 Abello, J.,
Broadwell, P., & Tangherlini, T. R. (2012). “Computational Folkloristics.” Communications of the ACM , 55(7), 60-70.
Cohen 2009 Cohen, Stuart, The likes
of us: America in the eyes of the Farm Security Administration (David R. Godine
Publisher, 2009).
Finnegan 2006 Finnegan, Cara A., “What is this a picture of?: Some thoughts on images and archives”
Rhetoric & Public Affairs 9, 1, (Michigan State
University Press, 2006).
Hancher 2016 Hancher, Michael. “Re:
Search and Close Reading”
Debates in the Digital Humanities 2016 (University of
Minessota, 2016).
Hurley 1972 Hurley, F Jack and Stryker, Roy Emerson,
Portrait of a Decade (Da Capo Paperback, 1972).
Jockers 2013 Jockers, Matthew Lee, Macroanalysis: Digital methods and literary history (University of Illinois
Press, 2013).
Mendelson 2003 Mendelson, Andrew, “Picturing Poverty: Print Culture and FSA Photographs”
Journalism History 29, 3, (EW Scripps School of Journalism,
2003).
Mora 2006 Mora, Gilles and Brannan, Beverly W, FSA: The American Vision (Harry N. Abrams, 2006).
Moretti 2005 Moretti, Franco, Graphs, Maps, Trees: Abstract Models for a Literary History (Verso, 2005).
Severin 1964 Severin, Werner J., “Cameras with a Purpose: The Photojournalists of FSA”
Journalism & Mass Communication Quarterly 41, 2, (SAGE
Publications, 1964).
Stange 1986 Stange, Maren, “Symbols
of Ideal Life: Technology, Mass Media, and the FSA Photography Project”
Prospects 11, (Cambridge University Press, 1986).
Stott 1973 Stott, William, Documentary Expression and Thirties America (University of Chicago Press,
1973).
Trachtenberg 1988 Trachtenberg, Alan and
Fleischhauer, Carl and Brannan, Beverly W and Levine, Lawrence W, Documenting America, 1935-1943, 2, (Univ of California Press, 1988).
United States 1981 United States. Farm Security
Administration and United States. Office of War Information and Library of Congress.
Prints and Photographs Division, America 1935-1946: The 87,000
Photographs of the Farm Security Administration and the Office of War Information in the
Prints and Photographs Division, Library of Congress: Index to the Microfiche
(Chadwyck-Healey, 1981).