Abstract
To examine changes in the diversity of popular songs over time, I have analyzed
the lyrics of 99% of all songs sung in English that have appeared on the U.S.
Billboard Hot 100 chart from 1956 up to and including 2016 (n=27.108). I have
found the number of songs that reached the Hot 100 per year more than halved
between 1966 and 2002, which indicates a loss in diversity. I have also found
that the variation of valence (or level of pleasantness) in the
songs’ lyrics and the variation of a sampled Type Token ratio (an indicator for
lexical complexity) decreases over time. This indicates that lyrics of popular
songs become more similar and again signify a loss of diversity.
Introduction
In September 2012 the Universal Music Group completed the acquisition of EMI
Music, reducing the number of worldwide music label conglomerates from four to
three: Universal, Sony Music and Warner Music Group. This was another step in
the concentration of media corporations that accelerated in the 1980s and 1990s
[
Bagdikian 2004] and gradually became a global media
oligopoly, a form in which a market or industry is dominated by a small number
of sellers. This oligopoly now not only controls music (e.g. 85% of the U.S.
recording music industry [
Lule 2012]) but also broadcasting,
movies, publishing and advertising markets. This concentration of media
ownership frequently raises concerns about the reduction of cultural diversity
communicated through major media channels. Some argue that this concentration
results in a shift away from serious news to infotainment [
Owen 2012] and that it becomes harder for independent record
companies to get airplay while large companies become more selective in the
artists offered to radio stations [
Lee 2004]. Even decades ago,
Theodor Adorno warned about the eroding effects of the transition from
autonomous works of art to profitable cultural products and the resulting
impediment of the development of individual consciousness due to a strong
cultural industry [
Adorno and Rabinbach 1975]. Yet, despite all these concerns,
the aforementioned acquisition of EMI clearly indicates that the process of
media convergence has not been halted.
This creates an opportunity to investigate the diversity of cultural output over
time to see if there is a homogenization of cultural meanings, values and
tastes. To do so, I have chosen to examine the diversity of an important and
omnipresent cultural product: popular music, by looking at changes in the number
of hit songs (songs that appeared on a chart, ranked by sales or popularity) and
lyrical variation over time.
Instead of stitching together lyrics of a few selected songs to represent popular
music, which has been, until recently, the default method for lyric related
studies, I will apply a macro analytic approach to grasp popular music as a
whole. With the ever increasing capacity and speed of computers it becomes
easier to create and quantitatively analyze large corpora of digitized texts and
other media to study underlying phenomena. It has been applied successfully in
many studies (e.g.
Moretti, 2005;
Jockers, 2011;
Michel,
2011;
Mauch, 2015). Note that
challenges remain, such as adequately representing popular culture. Merely
creating a large collection of song lyrics is not sufficient, for one can wonder
if every included song qualifies to represent popular culture. And perhaps even
more important: does the absence of all other similarly qualifying songs result
in bias? Many studies of lyrics of popular songs tackle this issue by using
charts, usually the U.S. Billboard Hot 100, to select songs that have earned a
certain level of popularity. These charts remain a “crude but effective” means to measure the
cultural impact of a song among the record buying public [
Stewart 2012].
However studies that rely on hit song charts predominantly use subsets, e.g. top
10 songs for every tenth year, and are therefore limited in scope and detail. To
contribute to the extensiveness of this study, I tried to collect lyrics of all
songs that appeared on the Billboard Hot 100.
Dataset and Methodology
The focus of this study is on lyrics from popular songs that charted in the USA,
arguably the most important market in popular culture. To overcome limitations
by scale, where only a few songs represent a much larger group, a major goal is
to collect and analyze as much lyrics as possible of songs that have appeared on
the Billboard Hot 100. Just by reaching a position on this chart, these songs
have proven their popular cultural mass appeal.
Despite its shortcomings, e.g. payola scandals and frequent changes in the
balancing of digital and physical sales and airplay influence, the Billboard Hot
100 is still by far the leading song chart of the USA and for several decades it
has been used for scientific research. By many it is regarded as the most
appropriate source for songs that were most representative of general cultural
preferences across time in the USA [
Pettijohn and Sacco 2009].
In order to have ample charting songs per year to be collected and analysed, the
scope is restricted to the years from 1956 up to and including 2016. Billboard
changed its weekly Top 40 chart of popular singles into a Top 100 in November
1955 and was renamed the Hot 100 in 1958. The year 1955 also roughly coincides
with the dawn of the
rock age when Rock ‘n’ Roll got a grip on the
Billboard charts and quickly turned the focus of popular music primarily towards
the youth and shaped popular music for at least the next forty years [
Garofalo 2008, 2].
The main source for the chart listings of songs, artists and years is Bullfrogs
Pond’s Billboard database, an extensive collection of Billboard related chart
data (1890-2017) maintained by an anonymous ‘avid music lover’ since 1999
(Bullfrog, 2016). Many randomly selected songs’ peak positions and years were
double checked with official Billboard Chart data (at Billboard.com and Joel
Whitburn’s “Top Pop Singles 1955-2012” (2013)) and
chart data at Top40db.net to verify the reliability of this source. Based upon
these sources I found that of all top 100 hits from 1956 up to and including
2016 (n=28.477), about 96% (n=27.387) of these songs have (predominantly) lyrics
in English, when instrumental (3.5%, n=986) and non-English lyric songs (0.4%,
n=104) are excluded.
The texts of these songs with lyrics in English were extracted automatically
[1] from several online archives
[2]. Simultaneously, automatic and manual
corrections were applied to restore song structures (e.g. replacing lines like
“repeat chorus” with the fully transcribed chorus) and to remove
mark-up, punctuation and metadata about performers or musical segments (e.g.
phrases like “written by”, “intro” or “guitar solo”). Eventually
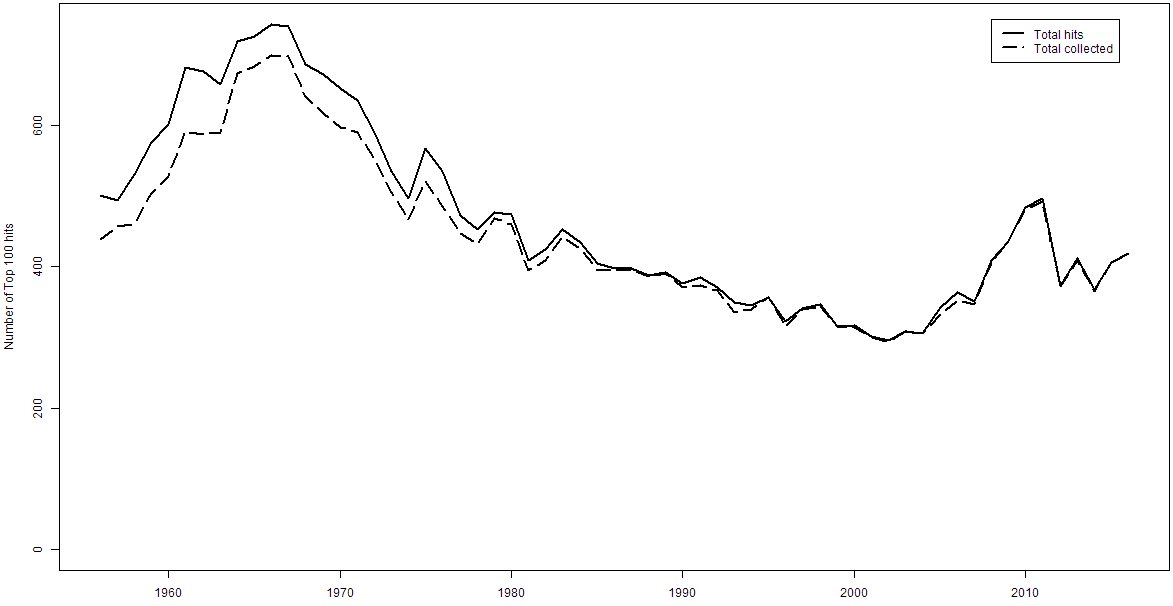
I managed to obtain the lyrics of all but 1% (n=279) of all songs sung in
English that charted on the Billboard top 100 charts from 1956 up to and
including 2016. This resulted in a corpus of 7.727.622 words in 27.108 song
files with an average of 444 examined songs per year,
see Figure 1.
Results
1. Changes in hit diversity
Inspired by Lee’s research on the radio industry [
Lee 2004], I
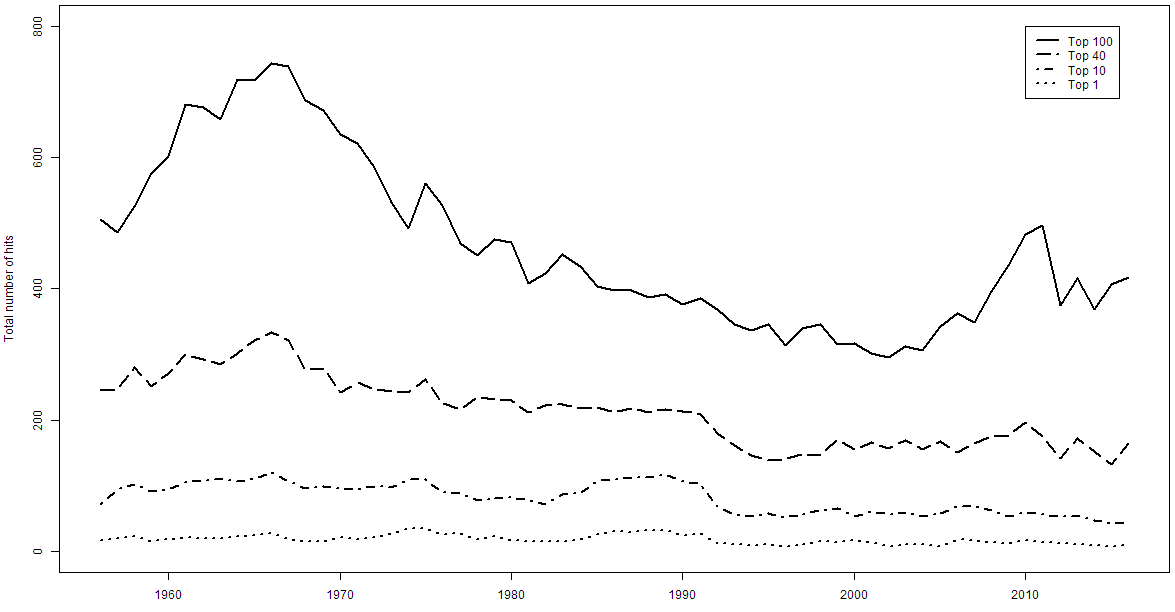
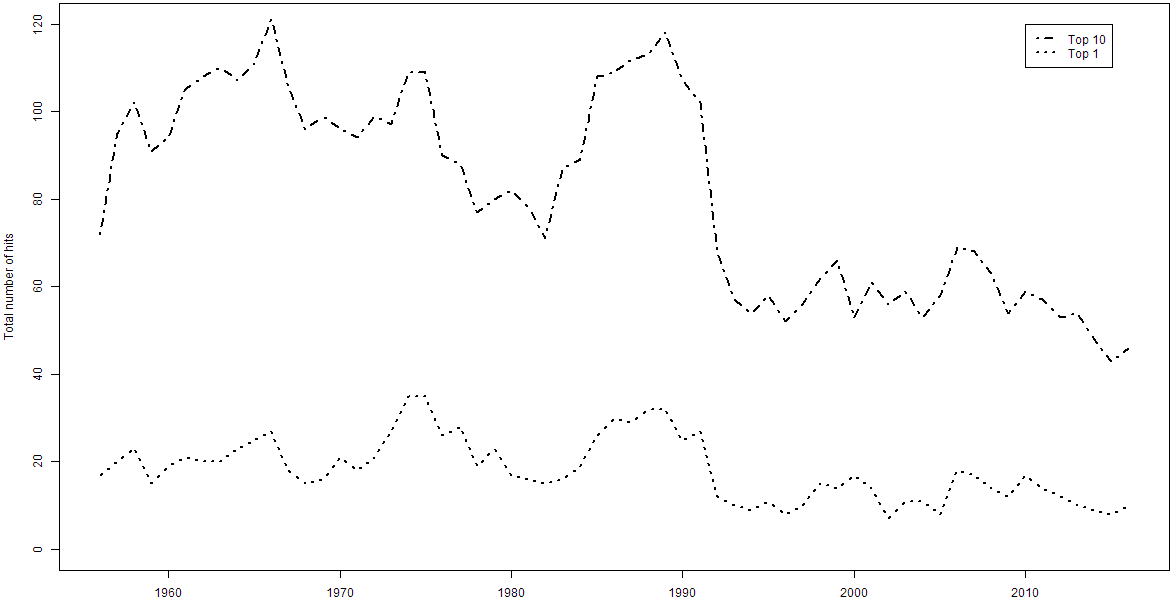
first examined the frequency of charting songs per year and found a sharp
decrease in the annual number of songs that obtained top 100, top 40, top 10 or
number 1 positions (see Figure 2a, and 2b, a detailed version of 2a).
The number of annual Hot 100 hits reached its low point in 2002 when 294 songs
charted, which is less than 40% of its peak in 1966 when 743 songs appeared on
the chart. Note that Figure 2b clearly shows a sharp decline in the total number
of yearly top 10 and number 1 hits after 1991.
It is very likely that these changes around the year 1991 were caused by an
alteration in the way Billboard tracks sales. In that year the Billboard Hot 100
switched to Nielsen SoundScan, a digital and improved system for tracking sales,
based upon data that represents over 90% of the U.S. music retail market [
Billboard 2013]. It replaced a manual, error-prone and easy to
manipulate system of calling selected stores about sales figures. Additionally,
Billboard then also started to remove descending songs after twenty weeks that
fell below position number 50, in order to make the charts more “current”
[
Billboard 2013]. In theory this could make more chart positions
available for new and yet uncharted songs, but it apparently did not prevent the
previously observed sharp decrease of annual charting songs, and led to an
increase in the average time songs spent on the charts. Perhaps the previously
used manual system caused an even greater removal of descending songs from the
chart.
Figure 2a and 2b also show that for the period
prior to the introduction of SoundScan in 1991, the number of Top 100, 40 and 10
hits per year was, except for a peak in the number of Top 10 songs during the
1980s, steadily decreasing since 1966. In the latter year 743 songs charted on
the Hot 100 and by 1990 this number was nearly halved to 376. Since several
studies have shown a positive relation between the number of different
recordings that reached the hit song charts and intensity of market competition
[
Peterson and Berger 1975]
[
Rothenbuhler and Dimmick 1982]
[
Burnett and Weber 1989], Figure 2a and 2b therefore indicate a loss of
market competition and diversity.
2. Changes in word usage
Inspired by Google’s Ngram Viewer [
Michel et al. 2011], I arranged the
lyric files by year and constructed a bigram viewer (see
http://www.petermeindertsma.com/lyrics/) to examine changes in the
popularity of word and term usage. In order to limit the influence of duplicate
terms in transcribed parts of the lyrics, e.g. in repeated choruses etc., I
calculated the percentage of annual songs in which these words occur, so each
song can only make one contribution to the popularity of a given word or term
per year. This method enabled me to visualize the popularity of these words over
time in order to signal trends,
see Figure 3.
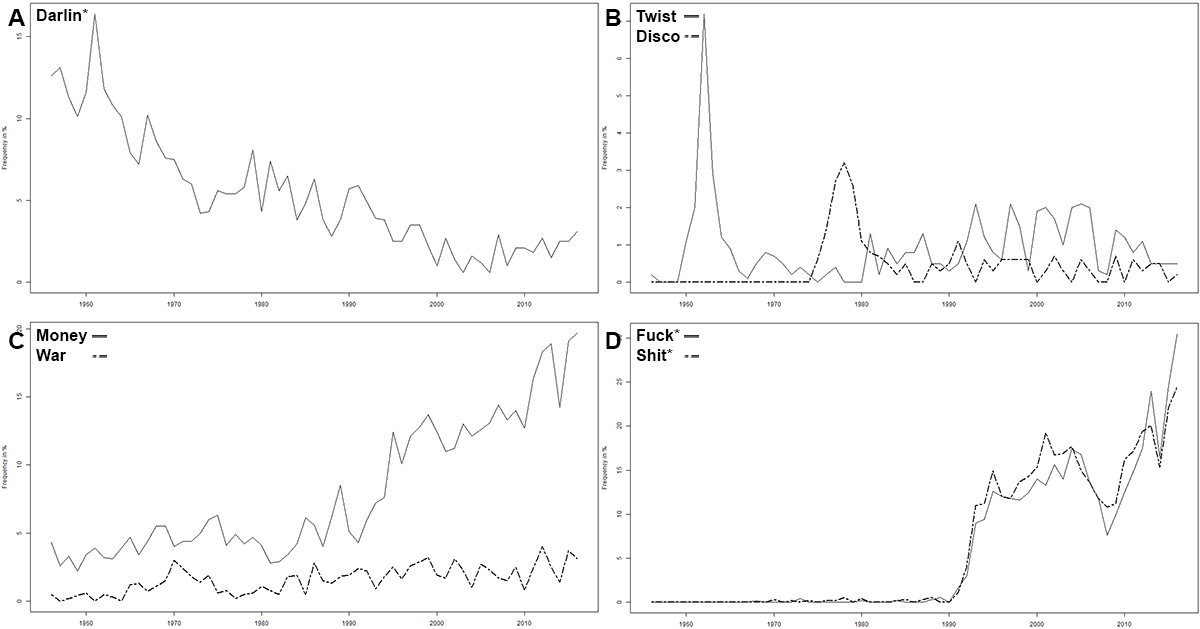
For example, a word like “darling” (or “darlin’”) clearly lost its
popularity (
Figure 3A). In a similar way this tool
can visualize the impact and duration of hypes in their times, e.g. dance crazes
(
disco, twist) (
Figure 3B), and
what was on our collective minds (e.g.
war and
money)
(
Figure 3C). This macro analytic approach
demonstrates a major benefit: results become quantifiable: For example, the term
twist is used in nearly twice as many songs in its peak year
compared to the term
disco (
Figure
3B). It can also visualize trends like the rapid increase of profanity in
lyrics since 1991 (
Figure 3D), especially when
compared to its gradual growth rate in books
[3].
This seems to signify an important change in American popular (music) culture
and deserves more research.
Although this visualization method can signal changes in the popularity of word
usage, it is too limited to examine changes in the homogeneity of popular
lyrics. Therefore other methods are needed, like the analysis of sentiment and
lexical complexity.
3. Changes in sentiment
To examine an aspect of changes in sentiment over time, I applied the Affective
Norms for English Words (ANEW) list. This is a word list developed by Bradley
and Lang to classify texts by valence (or “level of
pleasantness”) [
Bradley and Lang 1999]
[
Osgood et al. 1957]. This list contains 1034 words in English that have
a score for emotional weight on a scale from 1 to 9. For example, “love”
has a score of 8.72, “suicide” has 1.25. By adding these scores together
for each of these ANEW words’ occurrences, the average emotional weight for each
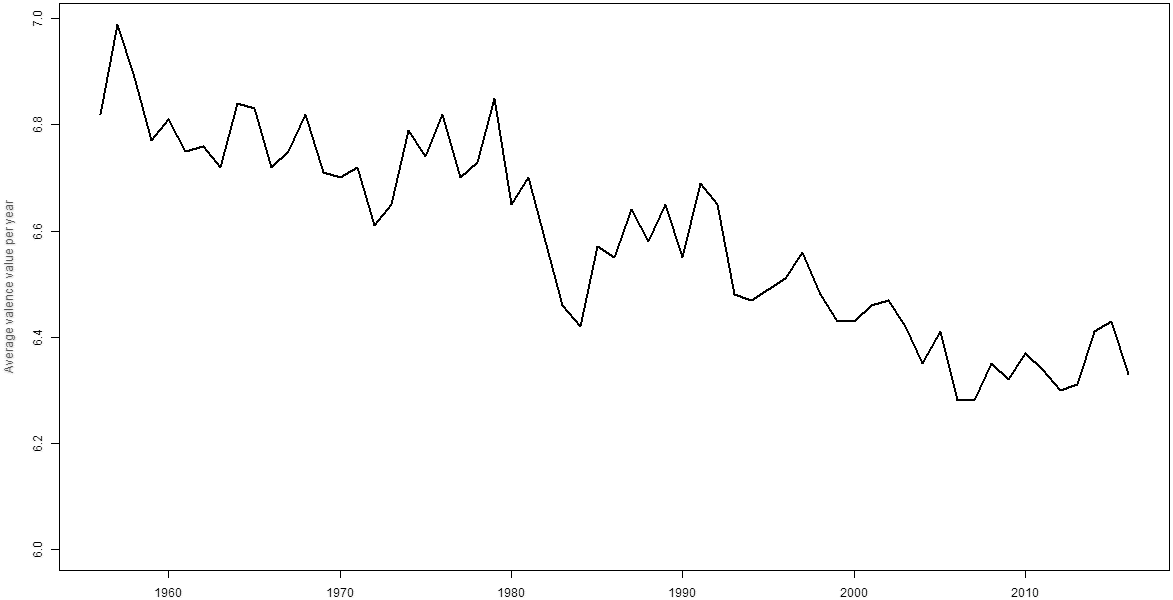
song is calculated. The resulting analysis is consistent with Danforth and
Dodds’ findings [
Danforth and Dodds 2010] that the average valence of lyrics
from popular songs is decreasing over time and songs on average are less
“happy” than ever before,
see Figure
4.
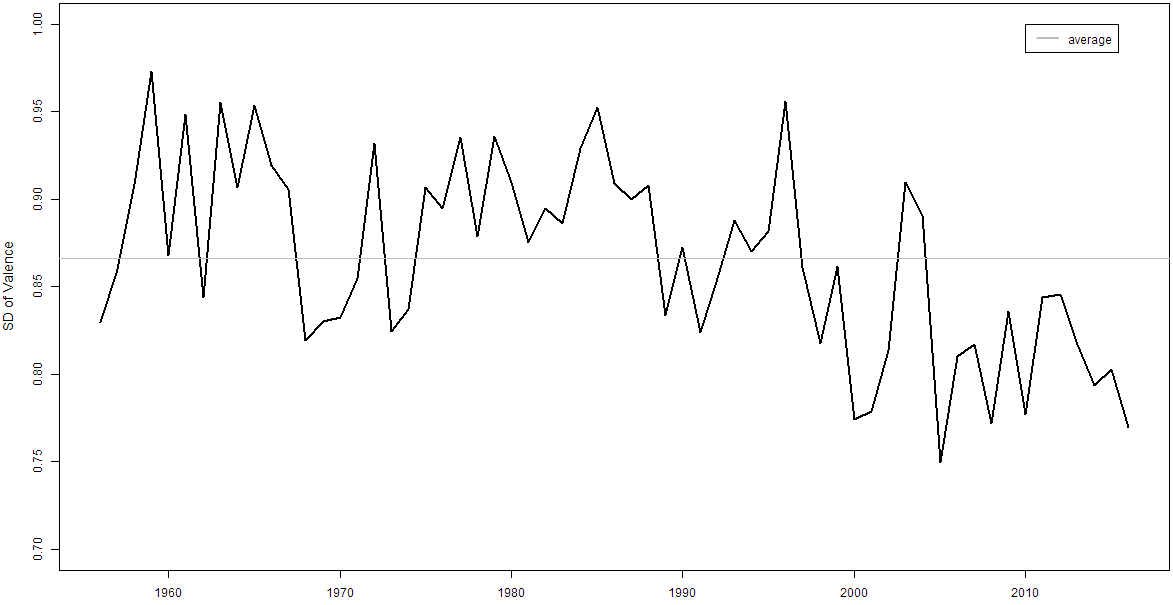
Finally, I examined the variance (standard deviation) of the average valence of
all songs per year,
see Figure 5.
Beside short-term fluctuations, the overall trend is a slow decrease in variance
over time, which indicates a trend towards homogeneity in lyrics of popular
songs.
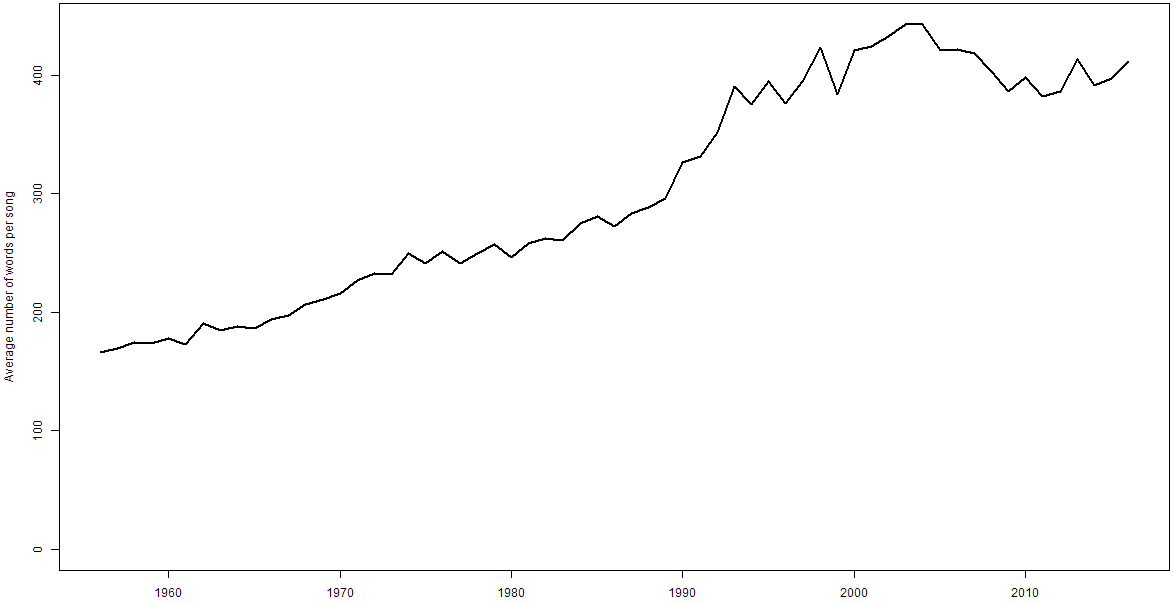
4. Changes in lexical complexity
To examine changes in lexical complexity, I computed the average number of words
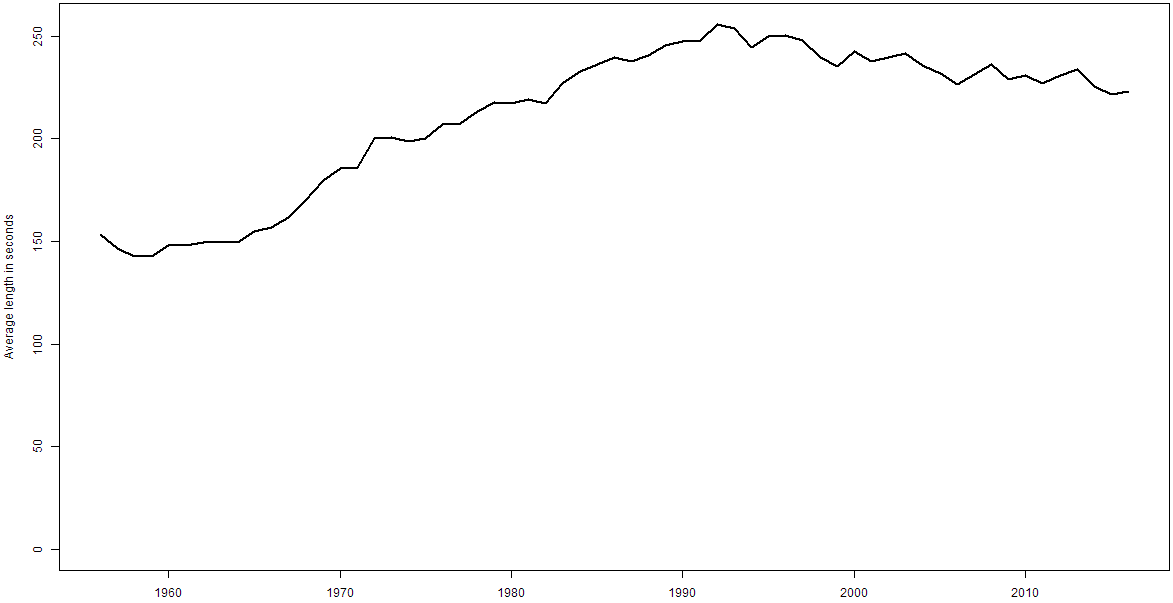
per song per year (
Figure 6) and used Bullfrogs
Pond’s data to find the average duration (length in seconds) per song over time
(
Figure 7).
Both graphs show a gradual increase over time. By 1994 the average number of
words per song has nearly doubled since 1960, while the average duration of
songs has increased by about 60% between 1960 and 1991.
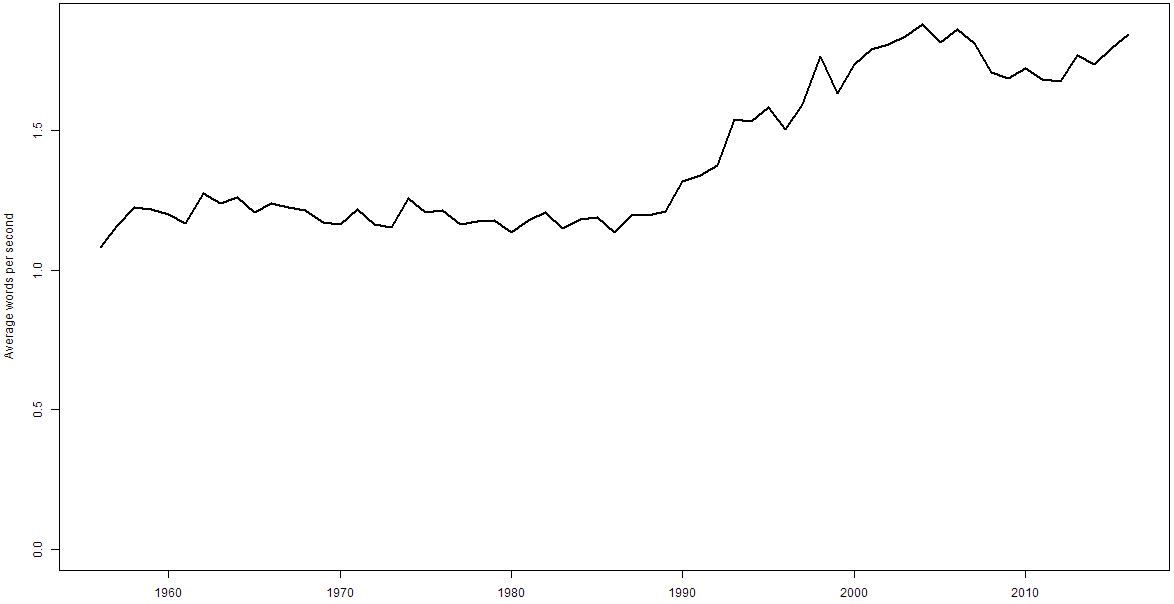
With this data, I also calculated the average number of words per second, which
remained fairly stable at about 1.2 words per second until around 1991 when it
started to increase rapidly and reached its (preliminary) peak in 2004 with 1.87
words per second,
see Figure 8.
This increase of the average of number of words per second in songs hints at an
increase in lyrical complexity. It also suggests, like my previous findings,
that a big change has occurred in popular music around 1991.
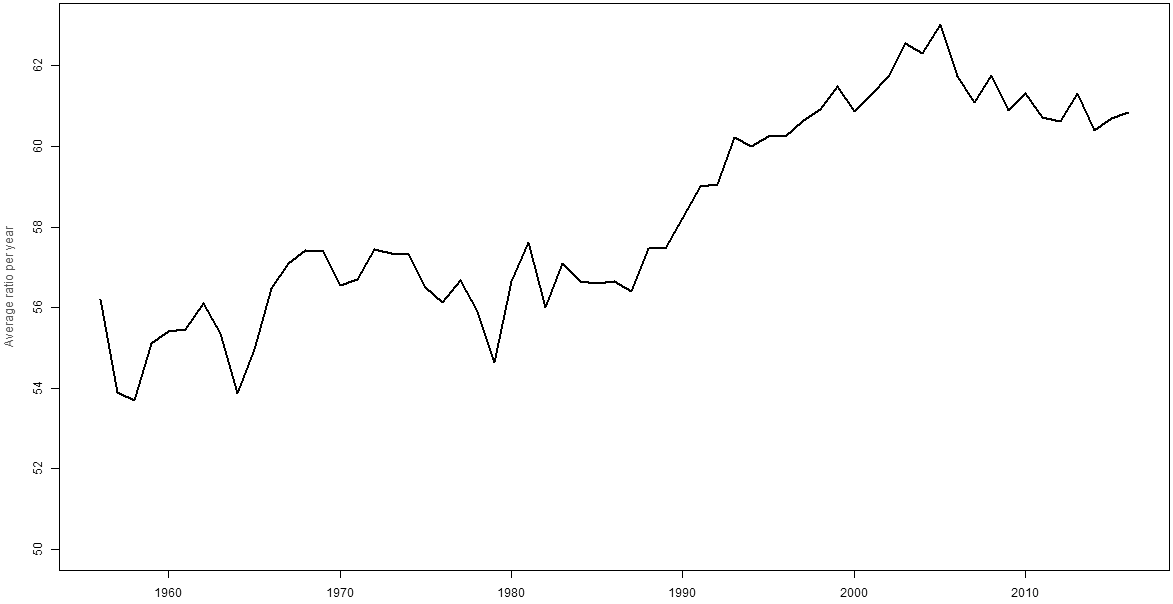
To further examine this likely increase in lexical complexity, I computed the
percentage of unique words per text or Type Token ratio. This is a frequently
used method to provide an estimate of lexical complexity where a higher
percentage indicates a higher level of complexity. However, this ratio is
affected by varying lengths of texts. Since I have previously demonstrated that
the average number of words per song has roughly doubled between 1960 and 1994
(
see Figure 6), I have used a sampling method
to compensate for the changes in average length of lyrics over time. From each
song’s lyrics, 75 words (sample size) were selected randomly to calculate the
song’s Type Token ratio. To reduce the influence of potential unintended effects
of this random selection, I repeated this process fifty times (!) per song in
order to achieve an average sampled Type Token Ratio. For different sample sizes
(50, 75 and 100 words), I found an increase in this sampled Type Token ratio
which indicates an increase in lyrical complexity, see Figure 9.
Note that the average Type Token ratio starts to increase considerably around
1990. This coincides with the rapidly increasing popularity of hip hop on the
Billboard Hot 100 around that time. For example, Katznelson et al. have found a
higher type token ratio for hip hop songs compared to rock and pop songs between
1989 and 2009 [
Katznelson et al. 2011].
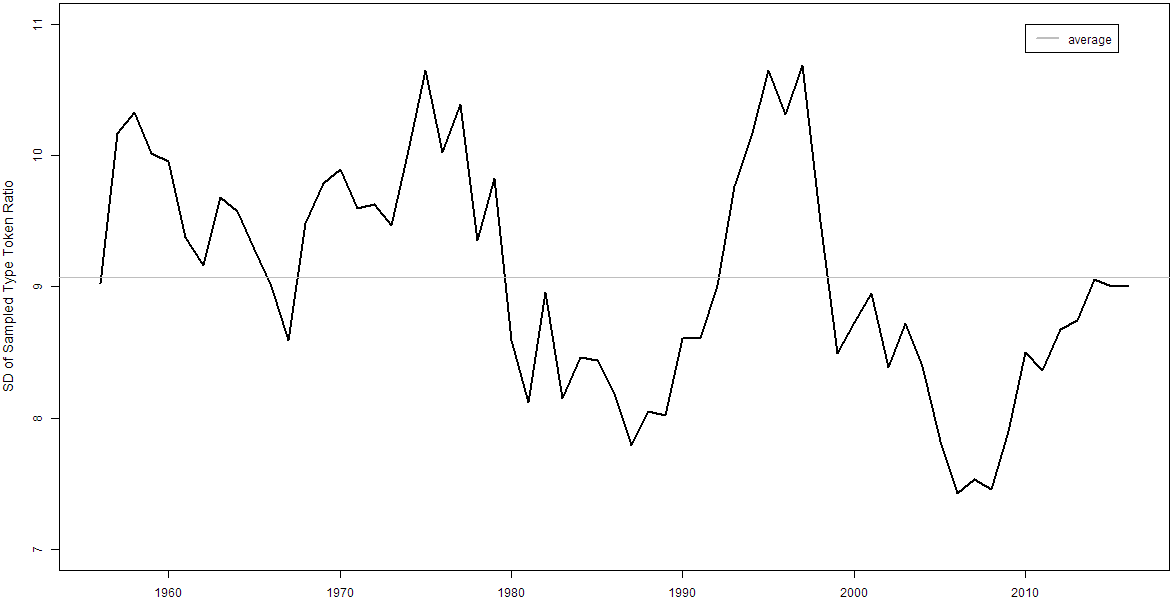
As for changes in lexical diversity, I have also examined the variance (standard
deviation) of this sampled Type Token ratio and it clearly fluctuates over time,
see Figure 10.
This variance roughly seems to behave like a sine wave cycle, repeating nearly
every twenty years. The global trend, however, is a slowly decreasing variance,
which means that lyrics become more similar and again indicates a loss of
diversity.
Limitations
The results of this study support the argument that the lyrics of popular songs
reveal a trend toward homogeneity over time. However, this work has several
limitations and acknowledging these can provide a better understanding of the
scope of these results and might improve further related research.
A first limitation is the restriction of using only lyrics of songs that charted
in the USA. Since this country currently accounts for about 4.5% of the world’s
population, these results cannot be applied internationally [
Arnett 2008]
[
DeWall et al. 2011] and require further research into other cultures.
Also note that this study focuses solely on the pop singles charts, which relate
strongly to youth culture. Other aspects of popular culture, e.g. more adult
oriented pop albums, radio station playlists, music venue owners, movie scripts,
popular fiction novels or special interest magazine articles, may yield
different results.
A second restriction is the potential imperfection of the examined lyrics. Due to
the lack of access to or absence of official sources, the lyrics were collected
from several Internet websites, and were, unfortunately, subject to errors.
These lyrics were most likely transcribed by individuals and could potentially
not always accurately reflect the official spelling of the words used. For
example, lyrics by British musicians could have been transcribed by American
individuals choosing the word “color” over “colour” and vice versa.
Additionally, since there were basically no online lyric archives before the
1990s, it is safe to assume that most of the transcriptions of songs from
previous decades were made long afterwards. Since language and peoples’
preferences gradually change over time, it seems likely that these lyrics do not
necessarily reflect the preferred spelling (fashions) of its original times,
e.g. words like “kissing” and “love” could have been replaced by
“kissin’” and “luv” respectively. For further analysis, stemming
and lemmatization techniques are recommended to improve some of these
issues.
A further challenge is related to the increasing average number of words used per
song over time. As I have shown previously
in Figure
6, the average number of words per song has doubled between 1960 and
1994. This means that, regarding my method of visualizing term usage over time
(
see Figure 3), songs from 1994 can, in
theory, contribute to the popularity of twice as many different terms compared
to that of songs from 1960. A word-weighing formula might be considered to
compensate for this.
Finally, the used method of measuring
valence has its limitations.
It is based upon only 1034 words that constitute the ANEW list and this in
general works better for longer texts. Also, the method of counting specific
words or phrases does not necessarily overlap with intended meaning, e.g.
sarcasm, hidden messages or context, like changes in time and space [
Danforth and Dodds 2010]. For example, some words with a low
valence value are from time to time used as words of approval
like “wicked” and “sick” and should therefore deserve a distinct and
higher value.
Unfortunately, this study’s focus on extensiveness comes with a price, as most
of the limitations mentioned above illustrate less paid attention to detail.
Ideally, for an all encompassing and thorough study, this macro analytic
approach can therefore not replace the traditional method of close reading, but
rather supplement it. For similar or larger sized corpora, this combination can
become very labor intensive. Nevertheless, for examining underlying phenomena
less focus on detail is required, as Bernoulli’s law of large numbers should
prove. The methods and results of this study therefore should only be applied to
improve our understanding of the big picture.
Conclusion and Discussion
In this study I have devised and applied a macro analytic approach for
re-evaluating our understanding of popular music’s last sixty years, especially
to examine if changes occurred in its homogeneity over time. Using this method,
I have analyzed the diversity of hit songs and their lyrics over time and found
that the number of annual charting songs on the Billboard Hot 100 has gradually,
but steadily been decreasing since the 1960s until 2005
[4]. I have also demonstrated that the variances of
valence (a level of pleasantness) and the variances of sampled Type Token ratio
(an indicator for lexical complexity) have decreased over time.
These findings all indicate a loss of diversity of popular songs and will
hopefully inspire further research to take the next step: examine if this
observed trend toward homogenization is a symptom of the aforementioned media
convergence, e.g. by analyzing differences in output diversity of large vs.
independent record labels over time.
Additionally, this study’s findings also demonstrate remarkable changes around
the year 1991. It is very likely that Billboard’s switch to SoundScan in 1991
influenced these changes, but the findings suggest other causes as well. The
rapid increase in the average number of words per song (
see Figure 6), words per second (
see Figure
8) and sampled Type Token Ratio (
see Figure
9), the further decrease in valence (
see
Figure 5) and the remarkable increase of profanity in song’s lyrics
(
see Figure 3D) indicate that popular music in
the USA has changed considerably at that time. This coincides with the time when
hip hop became a dominant music genre on the charts, at the expense of others,
e.g. music by British musicians and especially (classic, alternative and hard-)
rock music. This shift is arguably the most important event that shaped the
Billboard charts in the last sixty years [
Mauch et al. 2015].
As Figure 10 points out, I have also found that the variance of the sampled Type
Token Ratio roughly behaves like a sine wave cycle over time. Further research
can hopefully specify if periods of rapid increases (e.g. 1989-1994) correspond
with transitional periods in popular music (e.g. increased market competition
and changes of dominating genres), while the rapid decreases (e.g. 1977-1981)
are years of stabilization. This method can then facilitate predictions of
coming changes in the development in popular music and add to the debate whether
cultural products go through cycles [
Peterson and Berger 1975].
Finally, the remarkable increase in the number of annual charting songs that peak
between position 40 and 100 since 2005 (
see Figure
2a), indicates new changes in chart diversity, especially in the lower
chart regions, for the number of yearly Top 40, Top 10 and Number 1 songs has
not changed that much since 2005. This increase of annual charting songs is
likely due to Billboard’s inclusion of digital sales from online retail stores
such as iTunes for compiling the weekly Hot 100 charts since 2005 [
Billboard 2013]. These stores are in general not depending on the
physical availability and storage of singles and can offer a much larger and
more diverse and quickly accessible stock compared to offline retailers. Songs
are also no longer required to have a physical single release in order to chart,
which is exemplified by the simultaneous charting of many album tracks when
current popular artists like Taylor Swift and Eminem release much anticipated
new albums. It also enables short chart runs for (in general) short-lived
televised song performances, e.g. by American Idol artists (since 2002) and the
cast of the TV series Glee (since 2009). This increase in annually charting
songs could in theory indicate a new period of increased song diversity on the
charts, although the variances of valence (
see Figure
5) and Type Token ratio (
see Figure 10)
are still (slightly) below average.
It is nevertheless very likely that the composition of the Billboard Hot 100
chart will continue to change. For example, in February 2013 it started to
include YouTube (Vivo) streams, making it more susceptible for songs that
suddenly become a hit on the Internet (e.g. Harlem
Shake by Baauer). This change could lead to a further increase in
the number of annual charting songs and future research should reveal how this
affects the diversity of popular songs.
Acknowledgements
I want to thank Valerio Basile, Johan Bos, Leonie Bosveld-de Smet, Gosse Bouma,
Douwe Draaisma, Dicky Gilbers, Dore van Hoorn, Carel Jansen, Matthew Jockers,
Henny Klein, Daniël de Kok, Laura MacDonald, Kim Middel, Gertjan van Noord, Erik
Tjong Kim Sang, Nynke van der Vliet, Tity de Vries, George Welling, Dirk Jan
Wolffram and especially John Nerbonne and Kristin McGee for their time and
insightful comments.
Works Cited
Adorno and Rabinbach 1975 Adorno, T. W. and
Rabinbach, A. G. “Culture Industry Reconsidered”,
New German Critique, 6 (1975): 12-19.
Arnett 2008 Arnett, J. “The
Neglected 95%: Why American Psychology Needs to Become Less
American”, American Psychologist, 63 (2008):
602-614.
Bagdikian 2004 Bagdikian, B. The New Media Majority, Beacon Press, Boston
(2004).
Bradley and Lang 1999 Bradley, M. M. and Lang, P.
J. “Affective norms for English words (ANEW): Instruction
manual and affective ratings”, Technical Report
C-1, The Center for Research in Psychophysiology, University of
Florida (1999).
Bullfrog 2013 Bullfrogspond.com. “Billboard Pop ME (1890-2014)”.
http://bullfrogspond.com/ (accessed 15 May 2013).
Burnett and Weber 1989 Burnett, R. and Weber, R.
P. “Concentration and Diversity in the Popular Music
Industry 1948-1986”, Paper presented at the 84th Annual Meeting of
the American Sociological Association (1989).
Danforth and Dodds 2010 Danforth, C. M. and
Dodds, P. S. “Measuring the Happiness of Large-Scale Written
Expression: Songs, Blogs, and Presidents”, Journal of Happiness Studies, 11 (2010): 441-456.
DeWall et al. 2011 DeWall, C.N., Pond Jr., R.S.,
Campbell, W.K., and Twenge, J.M. “Tuning in to psychological
change: Linguistic markers of psychological traits and emotions over time in
popular U.S. song lyrics”, Psychology of
Aesthetics, Creativity, and the Arts, 5(3) (2011): 200-207.
Garofalo 2008 Garofalo, R. Rockin’ Out: Popular Music in the U.S.A., Pearson, Boston
(2008).
Lee 2004 Lee, S.S. “Radio
Industry Structure and Music diversity: 1989-2002”, Poetics, 32 (2004): 325-342.
Mauch et al. 2015 Mauch, M., MacCallum, R.M., Levy,
M., and Armand, L.M.\ “The Evolution of popular music: USA
1960-2010”,
Royal Society Open Science,
2 (2015):
http://dx.doi.org/10.1098/rsos.150081.
Michel et al. 2011 Michel, J.B. et al. “Quantitative Analysis of Culture Using Millions of
Books”, Science, 331 (2011):
176-182.
Moretti 2005 Moretti, F. Graphs, Maps, Trees: Abstract Models for a Literary History. Verso,
London (2005).
Osgood et al. 1957 Osgood, C., Suci, G. and
Tannenbaum, P. The Measurement of Meaning.
University of Illinois, Urbana (1957).
Owen 2012 Owen, D. “Media
Consolidation, Fragmentation and Selective Exposure in the USA”. In
SAGE Handbook of Political Communication, SAGE
Publications Ltd, London (2012): pp. 402.
Peterson and Berger 1975 Peterson, R. and
Berger, D. “Cycles in Symbol Production: The Case of Popular
Music”, American Sociological Review,
40(2) (1975): 158-173.
Pettijohn and Sacco 2009 Pettijohn, T. and
Sacco, D. “The Language of Lyrics. An Analysis of Popular
Billboard Songs Across Conditions of Social and Economic Threat”,
Journal of Language and Social Psychology 28(3)
(2009): 297-311.
Rothenbuhler and Dimmick 1982 Rothenbuhler,
E. and Dimmick, J. “Popular music: concentration and
diversity in the industry”, Journal of
Communication 32(1) (1982): 143-149.
Stewart 2012 Stewart, J. “What's Going On: Anti-War and Pro-War Hits on the Billboard Singles Charts
during the Vietnam War Era (1965–1975) and the 'War on
Terror'(2001–2010)”. In S. Gibson and S. Mollan. (eds), Representations of Peace and Conflict. Palgrave
Macmillan, Basingstoke (2012): pp. 67-85.
Whitburn 2013 Whitburn, J. “Top Pop Singles 1955-2012 (14th edition)”. Record Research,
Menomonee Falls, WI (2013).