DHQ: Digital Humanities Quarterly
2019
Volume 13 Number 3
2019 13.3  |  XMLPDFPrint

Narrelations — Visualizing Narrative Levels and their Correlations with Temporal Phenomena

Hannah Schwan <hannah_dot_schwan_at_fh-potsdam_dot_de>, University of Applied Sciences Potsdam
Marian Dörk <doerk_at_fh-potsdam_dot_de>, University of Applied Sciences Potsdam

Abstract

We present findings from interdisciplinary research at the intersection between literary studies, information visualization, and interface design. Despite a growing interest in text visualization among literary scholars, so far, narrative visualizations are not designed to support the particular tasks involved in narratological analysis and often fail to reveal nuanced narratological features. One major outcome of our iterative research and design process is Narrelations, a novel visualization technique specifically suited for analyzing and interpreting narrative levels of a story and temporal aspects of its narrative representation. The visualization provides an overview of the nesting and distribution of narrative levels, integrates the representation of temporal phenomena, and facilitates the examination of correlations between these aspects. With this research we explore how collaboratively designed visual encodings and interaction techniques may allow for an insightful analysis at a high level coupled with a close inspection of text passages. We discuss prior work relevant to our research objectives and explain the specific characteristics of narrative levels and temporal aspects of narrative representation. After describing the research process and design principles, we apply the visualization on a test corpus of eight annotated German short stories and demonstrate its heuristic value for literary analyses and interpretations. In particular, we explore the intricate connections between the literary content of the novellas and their narrative form.

Figure 1. 
The Narrelations interface is conceived for the visual analysis of specific narrative phenomena: the nesting and distribution of narrative levels and their correlations with certain temporal phenomena. Besides appraising overall patterns in a story, the interface enables to focus on individual passages and annotations by coupling visual and textual analysis. https://uclab.fh-potsdam.de/narrelations/

1. Introduction

Although the predominant mode of the academic discourse in the humanities has relied on text [Meister et al. 2017], visual formats, such as diagrams and visualizations, have always held an essential role for knowledge production [Drucker 2014]. With a growing recognition of digital humanities approaches towards literary text analysis and interpretation, visualizations of textual data are becoming more and more prominent. But despite the recent rise of digital methods, most visualization techniques for literary studies still exhibit an epistemological imbalance to communicating results, but seldom generating new knowledge. One facet of this reduction to presentation is the use of visualization as unquestioned data representations denying its interactive potential. However, the results of recent research on text visualization demonstrate the potential of interactive visualization for a broad range of linguistic and literary analyses [Jänicke et al. 2015a]. While many existing techniques rely on basic linguistic categories, often automatically extracted through natural language processing (e.g., [Vuillemot et al. 2009], [Muralidhara and Hearst 2013]), results from recent collaborations among visualization researchers and literary scholars highlight the virtues of interdisciplinary research (e.g., [Hinrichs et al. 2016], [McCurdy et al. 2016]). Connected with this line of research, our work explores the potential of text visualizations that are explicitly suited to support narratological analysis. In this paper, we introduce an explorative visualization (see Figure 1) as a heuristic method to augment a multi-layered interpretative examination of annotated literary text, in particular with regard to its narrative levels and temporal phenomena.
The paper is structured as follows: In section 2, we discuss prior work in text visualization, especially for the purpose of literary analysis. Section 3 is dedicated to the narratological principles relevant to our project. The visualization design process and principles are presented in section 4; and section 5 finally demonstrates the heuristic value of the visualization as applied to a test corpus of eight German novellas. In closing, we reflect on the results and discuss directions for future research.

2. Related Work

With our research we seek to devise a specific visualization technique that emphasizes the particular patterns and characteristics that literary scholars conducting narratological analysis are especially interested in. To consider related research on text visualization, we can differentiate between three main approaches:
  1. Gaining an overview over structural features of an entire story,
  2. Studying features and qualities of individual text passages, and
  3. Shifting back and forth between individual passages and the whole text.
While the specific structures and qualities may differ, these approaches apply more generally to many areas of text analysis and literary studies. The potential of text visualization for the purpose of literary and linguistic analysis has already been shown multiple times (e.g., [Jänicke et al. 2015a]). We briefly discuss prior work as it relates to our objective to support narratological analysis.
Many text visualizations focus on the syntactic or lexical structure of a document to provide a visual overview comprised of patterns and relationships. The most commonly and casually used text visualization is the tag cloud, in which the varying font sizes indicate word frequency [Viégas and Wattenberg 2008]. The common criticism that tag clouds decontextualize the displayed words can be (somewhat) addressed through interactive arrangements [Dörk and Knight 2015] and the integration of a keyword-in-context views (“kwic”, [Luhn 1960]) or a “word tree”, a hierarchical text visualization resembling a dynamic concordance [Wattenberg and Viégas 2008]. The “phrase net” technique relies on networks to show syntactic and user-defined relations between words in a text [van Ham et al. 2009]. Manually annotated text corpora can also be visualized at relatively high level, with the resulting views appearing far removed from the underlying documents and passages [Correll et al. 2011].
While a given text visualization technique may focus on a particular linguistic or literary category, a range of visualization environments demonstrate the potential of multiple views for multi-faceted text analysis [Vuillemot et al. 2009]; [Muralidhara and Hearst 2013]. Close collaborations among visualization and literature scholars can yield highly specific representations for data sets and tasks [Hinrichs et al. 2016]. For example, the “Speculative W@nderverse” features a multi-view interface that incorporates hierarchical, temporal, and material qualities of a unique literature collection. Building on this line of work, we seek to devise a visualization technique particularly pertaining to narratological features that can range from single words to multiple pages.
Especially with regard to the analysis of narrative levels it is important to preserve the original order of the text and being able to scrutinize different levels in their surrounding context. When considering these two requirements, there are two kinds of text structure visualizations to consider: visualizations of narrative or plot. In either case, most of these visualizations are based on character interactions in different scenes in drama or movie scripts, which can automatically be extracted as they are well-structured. In 2009, several hand-crafted visualizations appeared on the webcomic xkcd to show character interactions in popular Hollywood movies [Munroe 2009]. This visualization known as storylines has shown to be very popular, not only among the webcomic’s audience, but also in the information visualization community. There are a number of works building on this visualization style and trying to turn it into generative visualization algorithms ([Hoyt et al. 2014], [Liu et al. 2013], [Tanashi and Ma 2012]). While these techniques are highly relevant for our work, we are particularly interested to examine the hierarchical and temporal characteristics in the progression of the narrative. The storylines technique has been extended to include the representation of non-linear story developments by arranging sessions (events) as layers on a hierarchical circular layout [Qiang et al. 2017]. While resembling our visualization in appearance, the hierarchical layer position does not reflect narrative level, nor story, but is calculated based on the length of sessions and a space-compression algorithm. In contrast to the aforementioned visualizations, the story curves interface allows scholars to compare different narrative features and relate narrative order and chronological order of events [Kim et al. 2018]. In addition to the representation of order, we seek to find an adequate representation for temporal duration and frequency.
The term “close reading” describes the traditional scholarly way of interpreting a text by reading it repeatedly, underlining or highlighting text passages, and registering observations in the margin of a book page. Depending on the type of text and its context, attempts to translate this activity to the digital realm have more or less resulted in views reproducing the analog context [Kehoe and Gee 2013], [Meister et al. 2016]. There are certain use cases, like the analysis of poems, in which scholars study structural or sonic features on the word or sentence level [Chaturvedi et al. 2012], [McCurdy et al. 2016]. For the purpose of narratological analysis of short stories and novels, a combination of a simple close reading view and an overview visualization may be more appropriate.
A recent survey of text visualization techniques for close and distant reading shows that the number of works that combine both perspectives is increasing [Jänicke et al. 2015a]. On the one hand, the ability to swiftly move from an overview visualization to a close reading view seems to align with the workflows of humanities scholars. On the other hand, this duality is an application of the longstanding visualization truism “Overview first, zoom and filter, details-on-demand”  [Shneiderman 2003]. However, only few text visualizations fully support deliberate shifts between distant and close reading views. One exception is “VarifocalReader”, an interface that offers multiple levels of abstraction of scanned and transcribed text [Koch et al. 2014].
In sum, while there is a great variety of text visualizations designed to support a sense of overview and allow for comparison of textual structures, research on visualization interfaces that support the continuous switching between close and distant levels is still scarce. Furthermore, existing visualizations of narrative structures remain fairly limited and fail to reveal more nuanced narratological features.

3. On Narratological Analysis

This section is dedicated to elaborating the analysis tasks and data structures that are common in narratological analysis of literary texts, more specifically, the analysis of the narrative level structure and the temporal representation in these texts. The data used for this research was generated in a computer-assisted, collaborative annotation approach.

3.1 Narratological Analysis

One of the main objectives of literary studies is to develop plausible and innovative interpretations of literary texts. In a first approach to interpreting literary narratives, it can be helpful to start with a narratological analysis of the text. Narratology is widely regarded to provide analytic categories that allow for a systematic, detailed, and often intersubjective description of narratives. These descriptions can then serve as a heuristic for interpretation [Kindt and Müller 2003]: They point out interesting structural or thematic features of the texts – and one important objective of interpreting the text may lie in finding an explanation of why the text exhibits these particular features.
Since narratological analyses are considered a heuristic tool, literary scholars need a way to fruitfully explore these analyses so that they can develop interpretation hypotheses from them. Such an exploration, however, is complicated by the fact that narratological analyses can get very complex and fine-grained – and they are usually scattered throughout the (sometimes rather long) texts, which makes it difficult to get an adequate overview. If the analysis is aimed at comparing different narrative texts across a corpus, its exploration becomes even more difficult.
The special challenge for literary scholars developing interpretations with the help of narratological analyses then lies in being able to switch back and forth between an explorative overview over their analysis results and a close view on individual text passages that seem especially interesting and require a more thorough examination. This iterative process of oscillating between part of the text and the text as a whole is a characteristic feature of hermeneutic text understanding and has been described as the hermeneutic circle [Schleiermacher 1838], [Dilthey 1900] or hermeneutic spiral [O'Toole 2018] in literary theory.
In the following, we discuss the specific characteristics of the two narrative phenomena our research focuses on: narrative levels and temporal aspects of narrative representation.

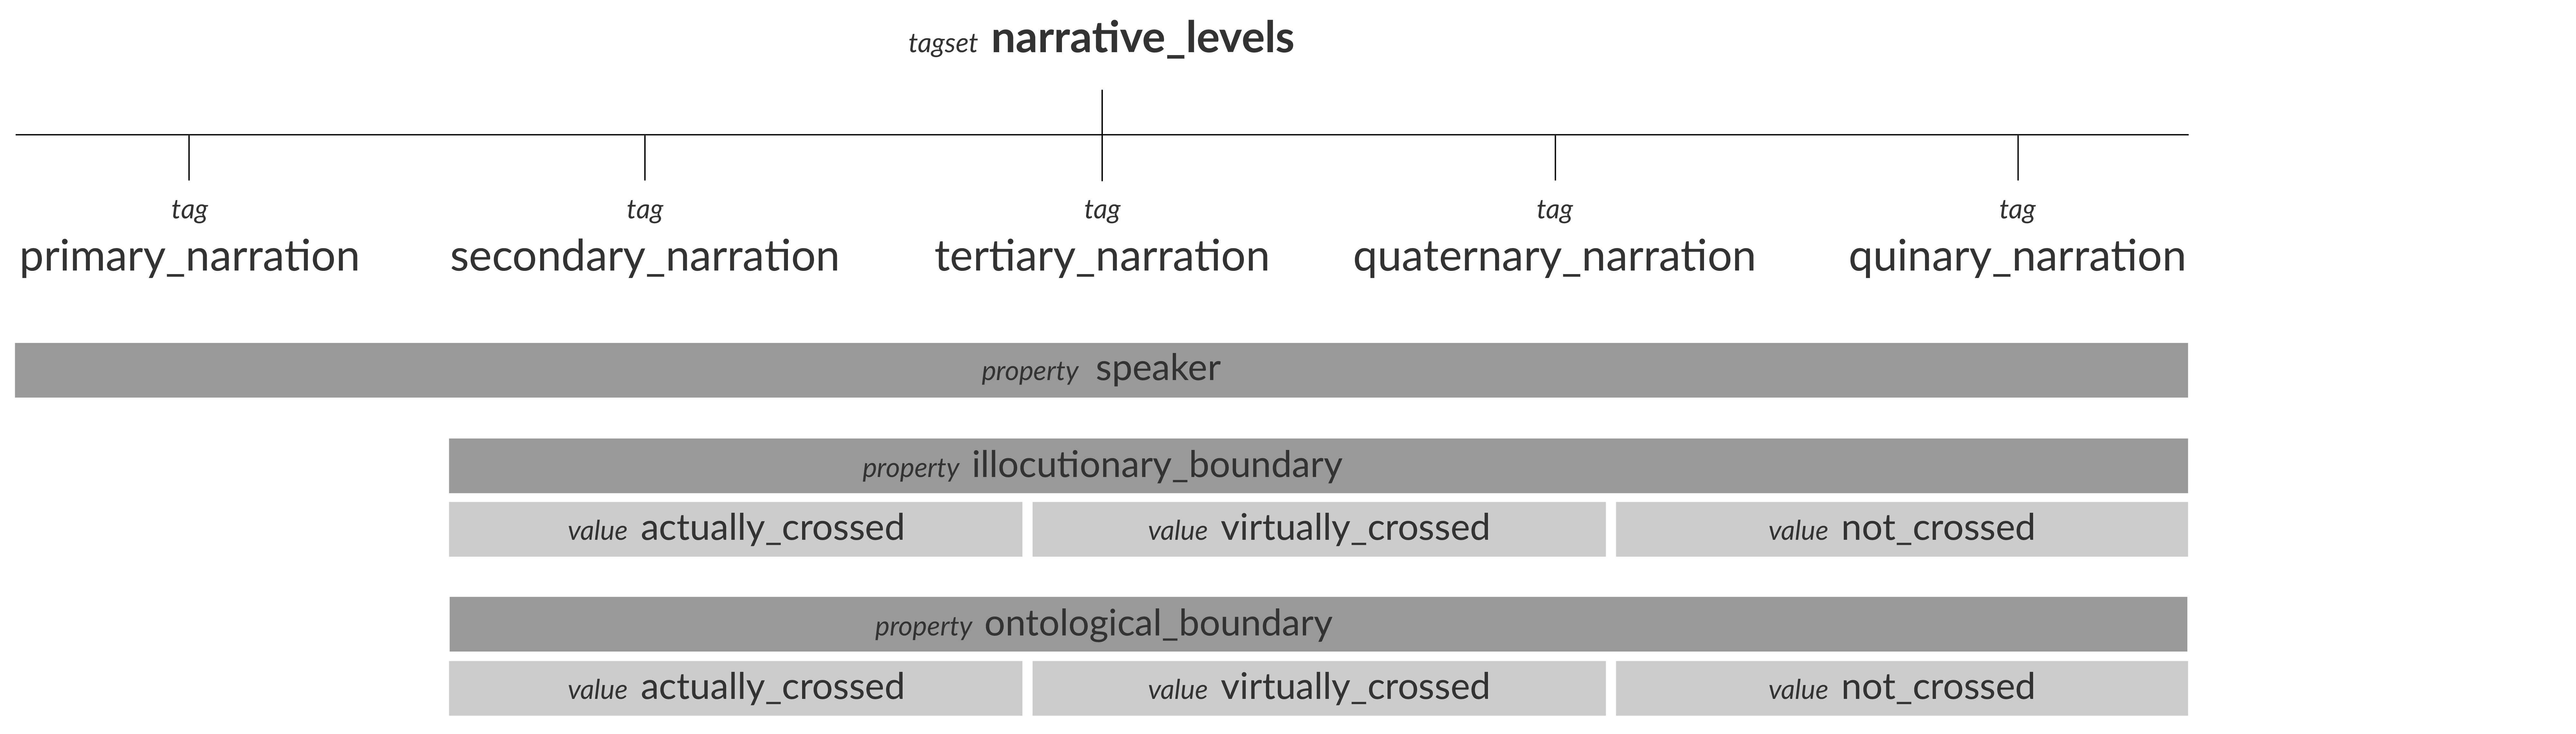
3.2 Narrative Levels

The term “narrative level” refers to the phenomenon of embedded narrations that can occur within the ‘frame narration’ of a literary text.
The concept of narrative level is special in at least two respects:
  1. Narrative level is an especially important and basic narratological concept insofar as the segmentation of a text according to narrative levels as well as the classification of each level heavily influences the analysis of many other narrative phenomena. To analyze a narration according to its narrative level structure is thus well-suited as a first explorative step with which to start a narratological analysis.
  2. Though basic, the narrative level concept is a very complex narratological category. Narrative levels may occur multiply nested and can be distinguished according to a multitude of parameters. The complexity of the phenomenon poses a challenge for a heuristically powerful visualization concept.
According to Ryan’s account [Ryan 1991, 175–200], the most basic narrative in a text constitutes the primary narration. New, embedded narrative levels can then occur within this primary narration, where they constitute so-called secondary narrations. If new, embedded narrations then emerge from a secondary level, they are called tertiary narrations – and so on. The degree of embedding (primary, secondary, tertiary etc.) is one crucial parameter to consider in narrative level analyses.
A new, embedded narrative level occurs whenever an illocutionary or an ontological boundary is crossed. An illocutionary boundary is crossed whenever a new, embedded speaker or narrator occurs, e.g., when a character in the text rises to speak[1]. An ontological boundary, on the other hand, is crossed whenever a new system of reality or “world” occurs in a narration. This is, for example, the case when an entirely new fictional world is narrated in a text – but also if a narrative contains other kinds of “non-actual” passages, like hopes, dreams, wishes, illusions, etc. Since illocutionary and ontological boundary crossings can occur in combination, but also independently of each other, this makes for three possible combinations:
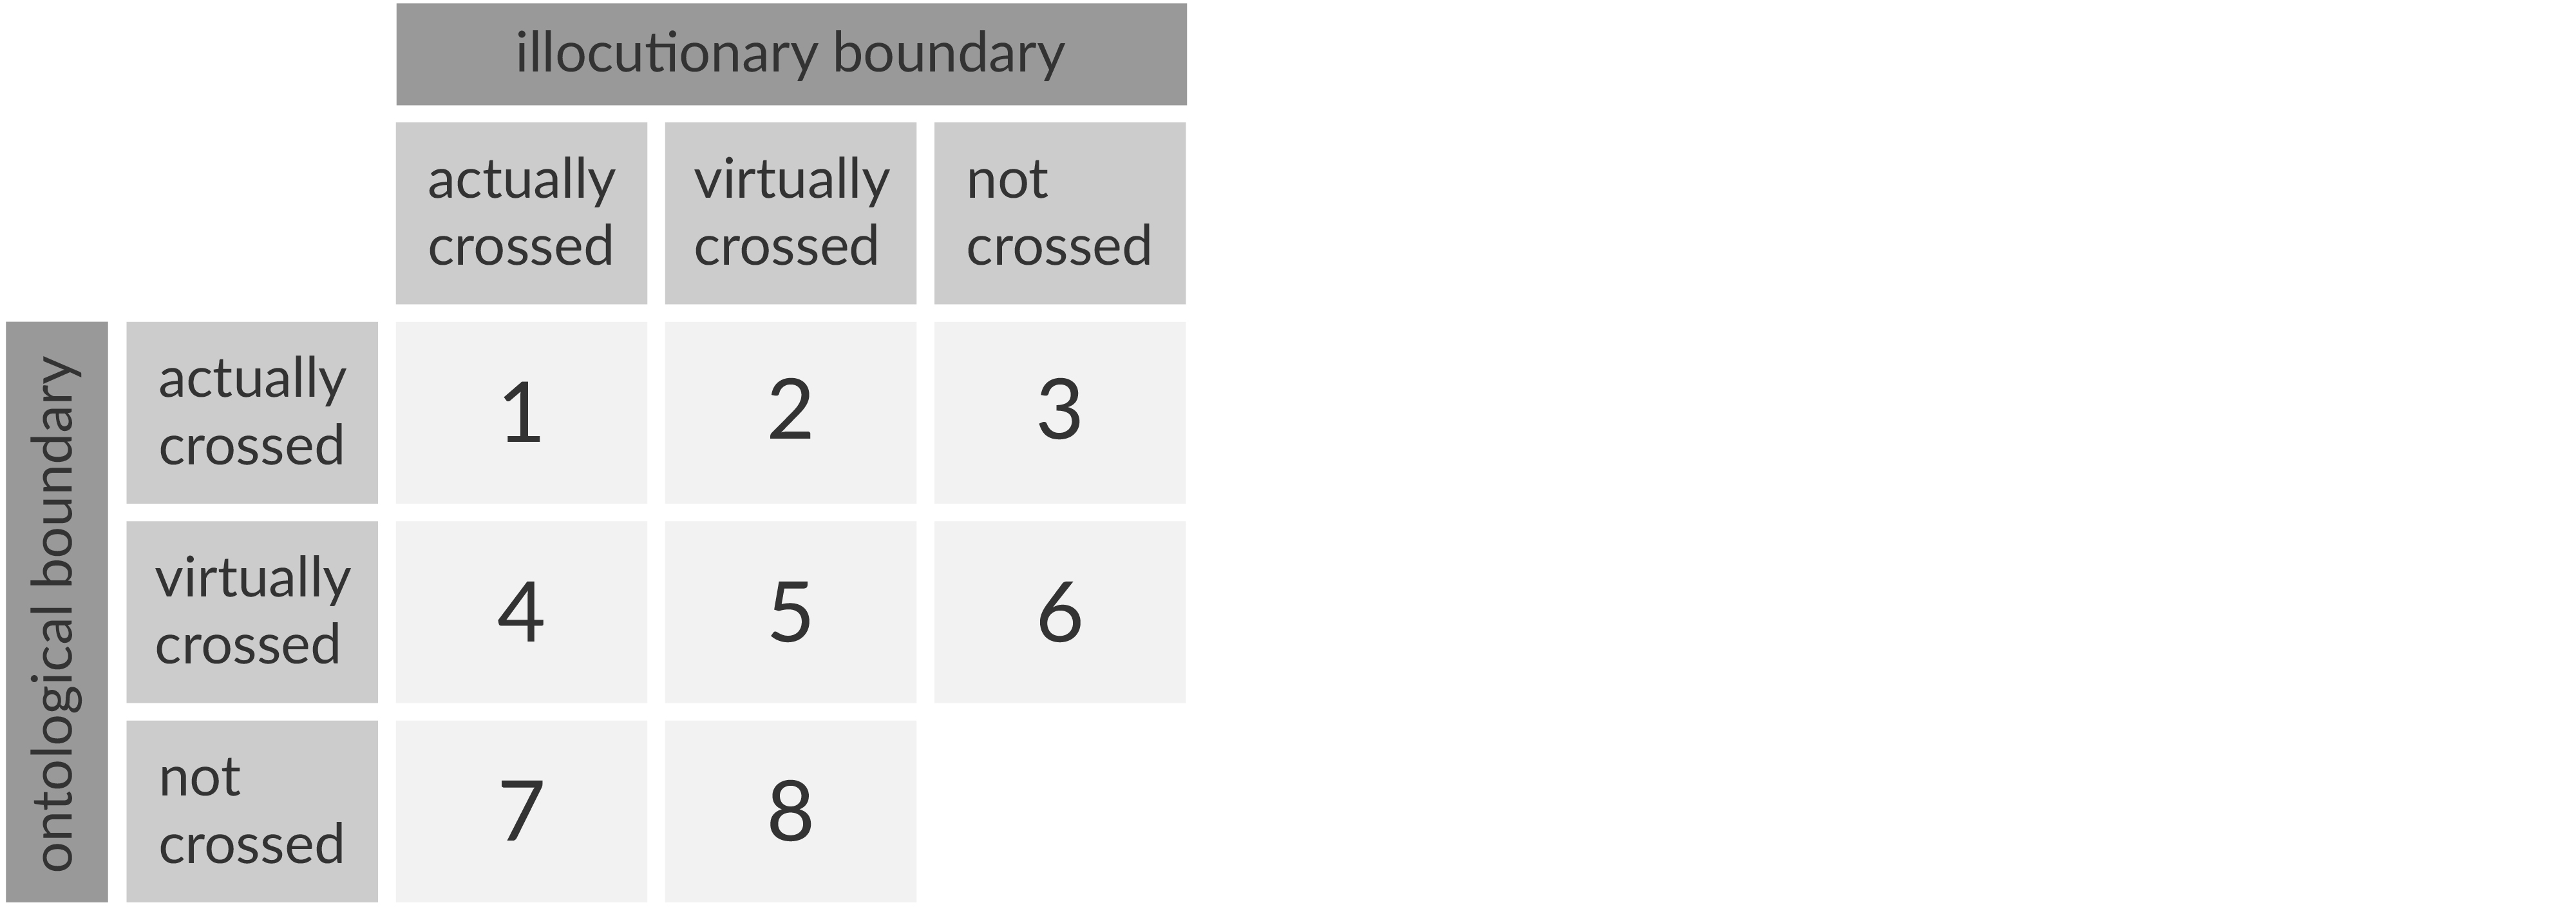
  1. illocutionary and ontological boundary crossed;
  2. illocutionary boundary crossed, ontological boundary not crossed;
  3. illocutionary boundary not crossed, ontological boundary crossed.
The narrative level analysis is further complicated by the fact that both types of boundaries can be crossed in two different modes: either actually or virtually. In the case of illocutionary boundaries, an actual crossing occurs whenever the utterance of a new speaker/narrator is quoted directly – a virtual crossing, on the other hand, occurs when the new speaker’s utterance is presented in indirect speech. In the case of ontological boundary transgressions, an actual crossing occurs whenever the new, embedded world is presented as new reality. Virtual crossings, on the other hand, occur when the text contains constant reminders of the counterfactual status of the new, embedded world. If we now consider both the type of boundary that is crossed (illocutionary or ontological) and the mode of the crossing (actual or virtual), this now makes for eight possible combinations (Fig. 2).[2]
As becomes immediately clear, a thorough narrative level analysis has to account for so many different parameters (distribution, degree of embedding, narrator, type of crossed boundary, mode of boundary crossing) that it is very challenging to get an adequate overview of all relevant parameters in one representation.
Figure 2. 
Possible combinations of types and modes of boundary crossings.

3.3 Temporal Aspects of Narrative Representation

As we mentioned earlier, narrative level analyses directly influence a number of further narratological analyses – even some of the presumably basic and straightforward ones. We would like to illustrate this by taking temporal narratological analysis as an example. According to Genette [Genette 1980], the temporal structure of narratives can be analyzed according to three categories: order (is the story presented chronologically or not?), frequency (how often are the events of the story narrated?), and duration (how long does the narration of the story events take?).
Now, there are two interesting ways in which an analysis of the narrative level structure of a text and a temporal analysis relate to each other:
  1. As detailed in [Gius and Jacke (submitted)], the analysis of narrative levels influences the temporal analysis in such a way that a thorough and reasonable temporal analysis is only possible if it is preceded by a narrative level analysis.
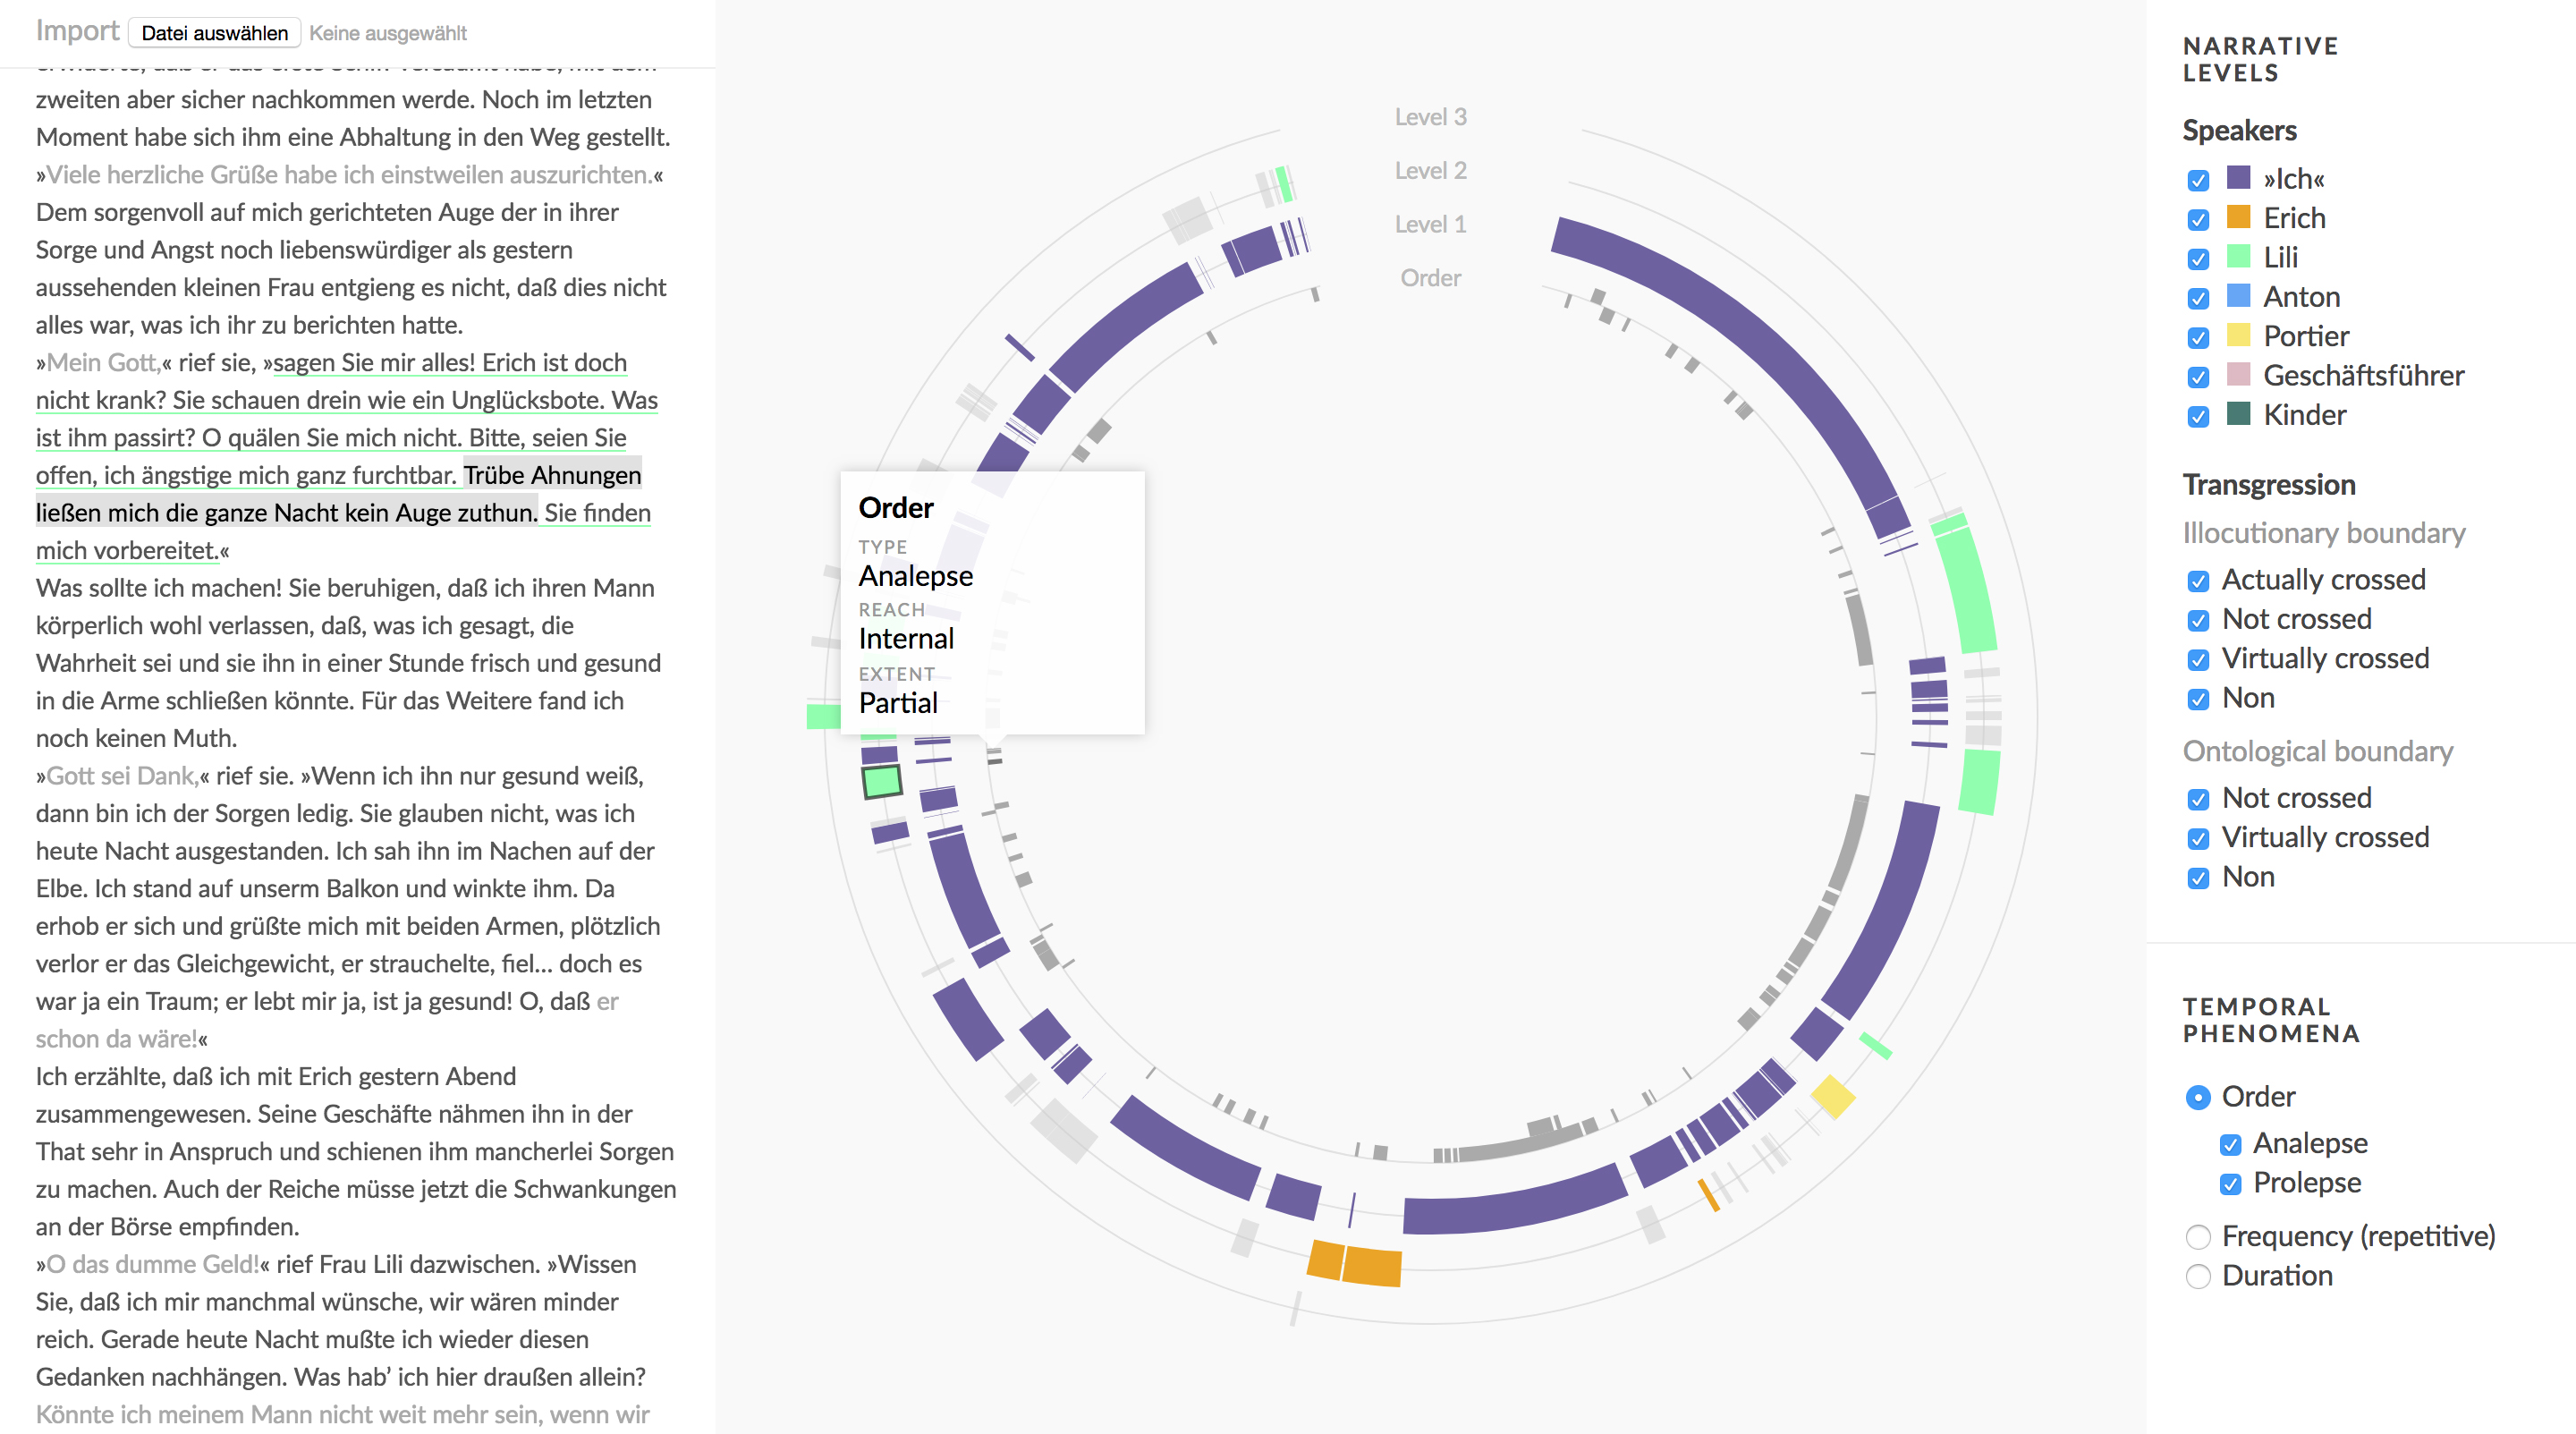
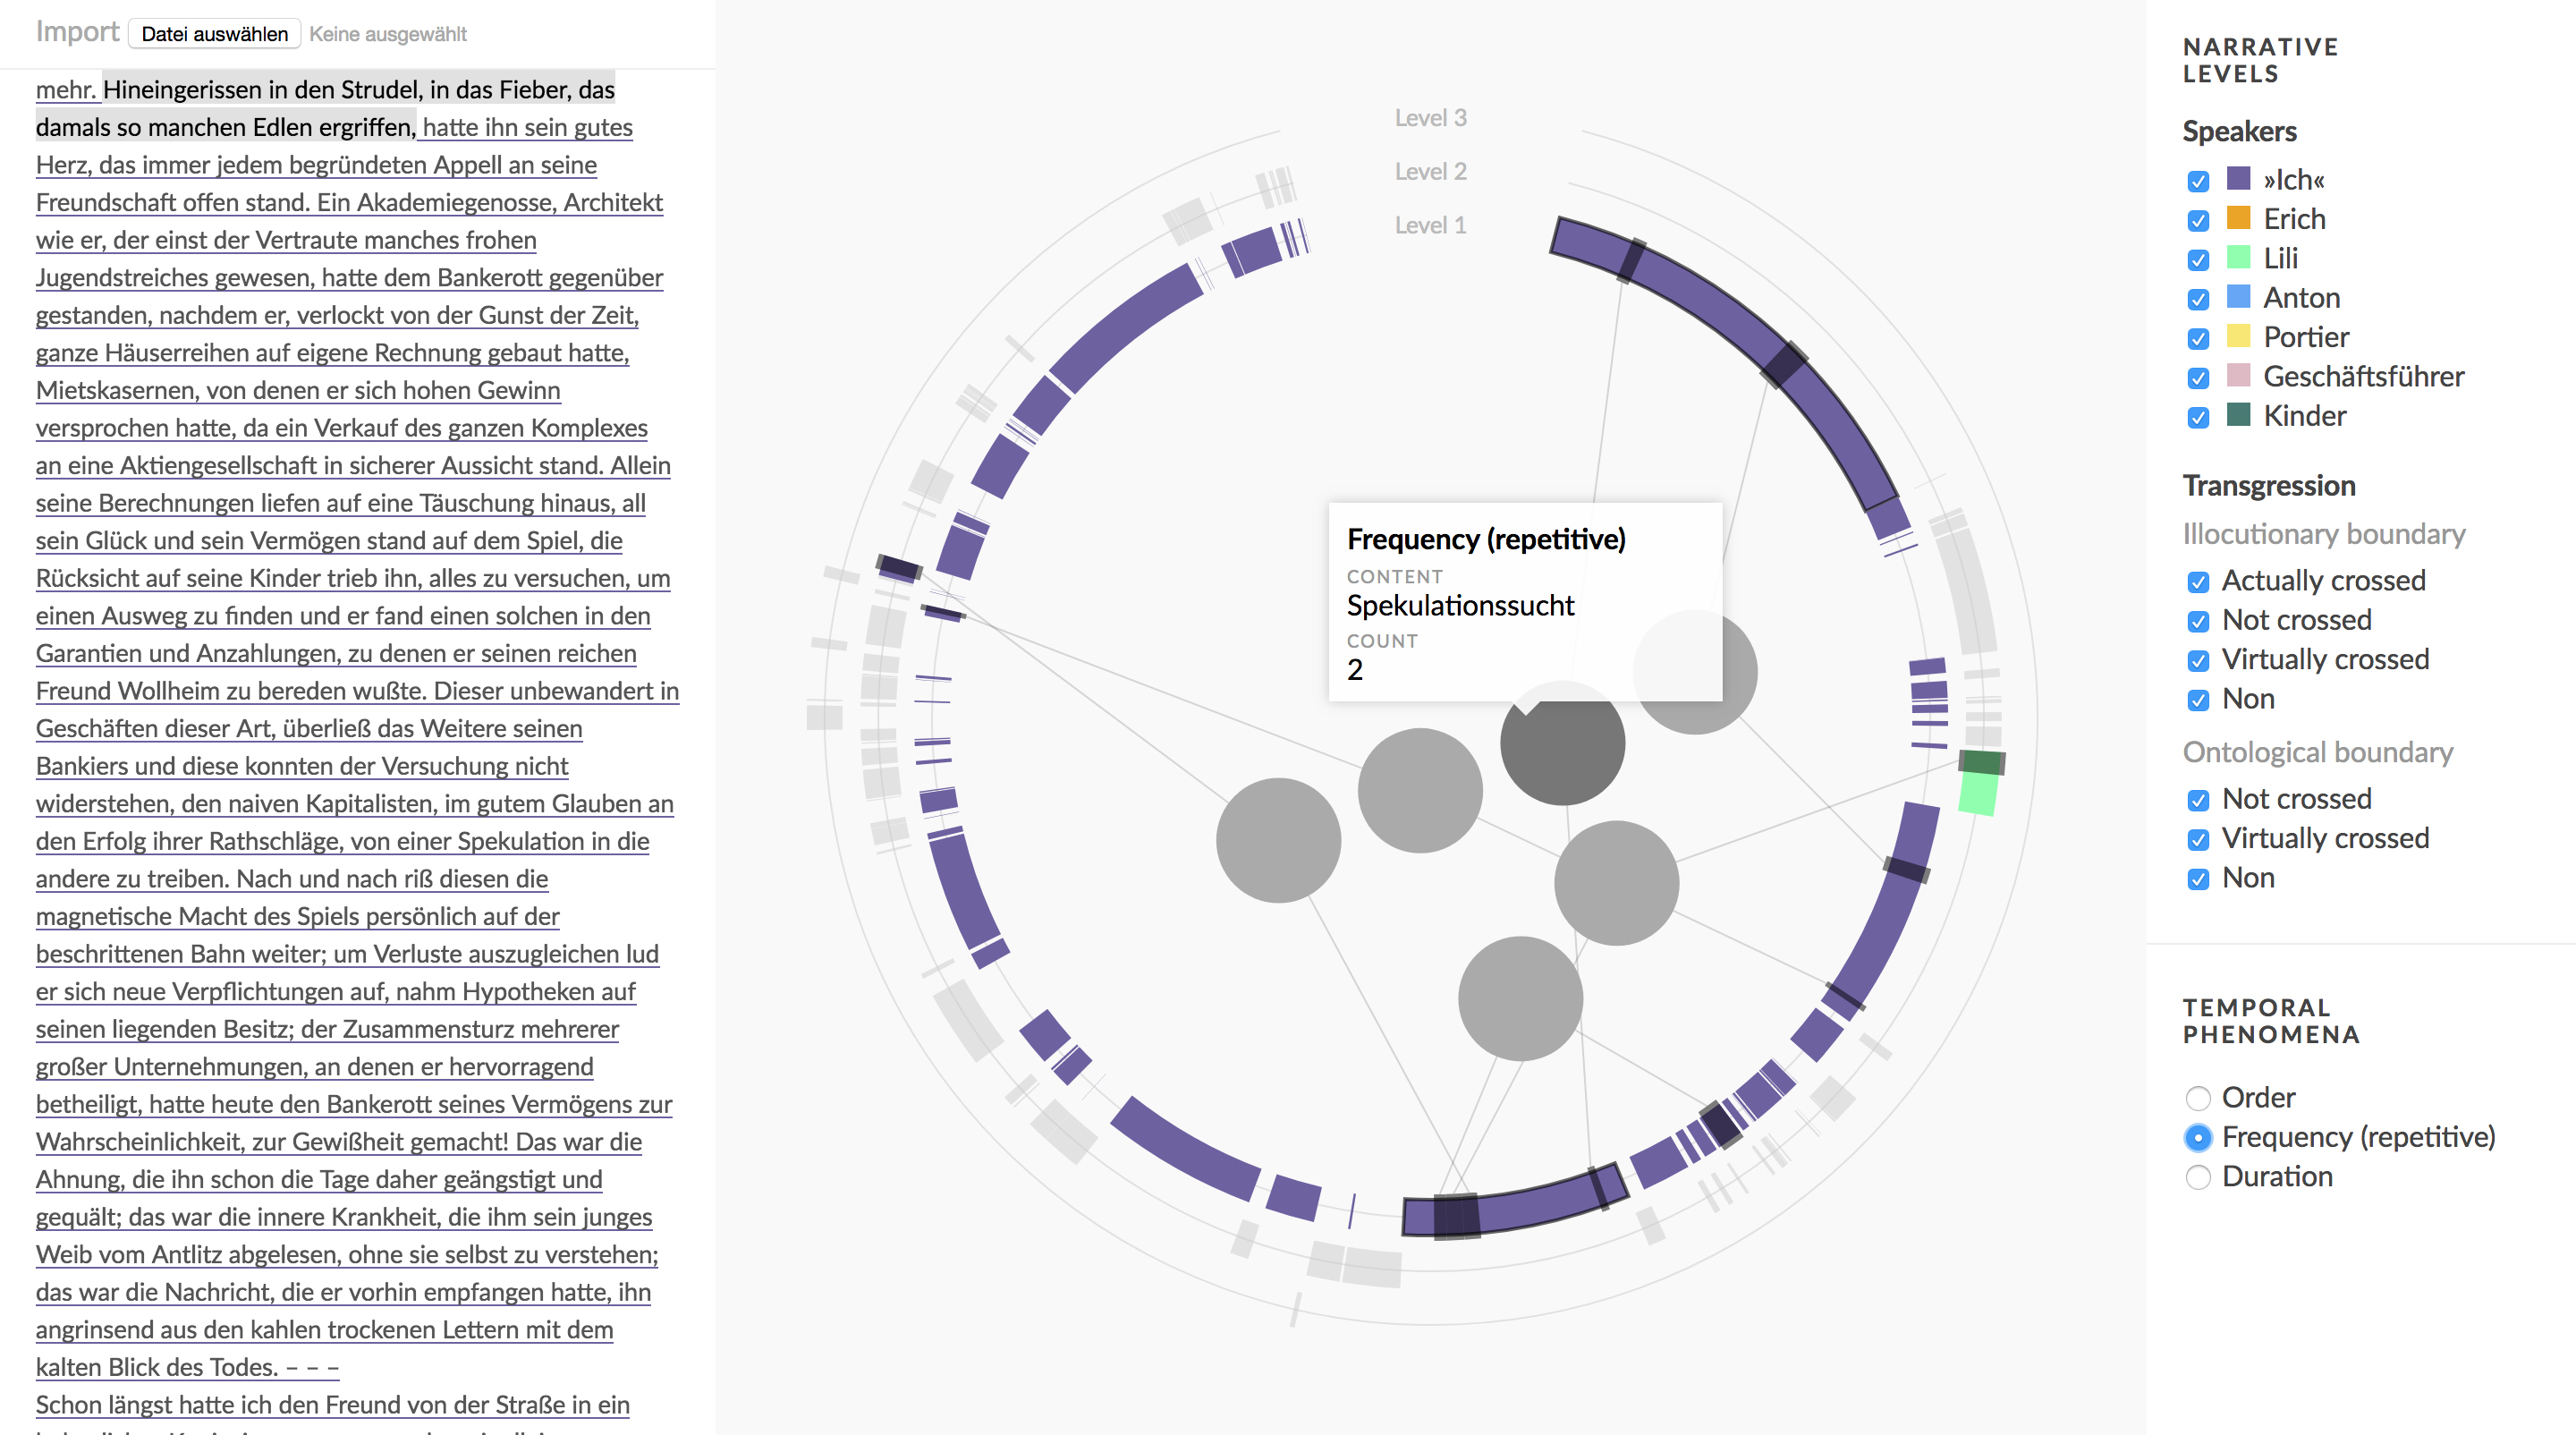
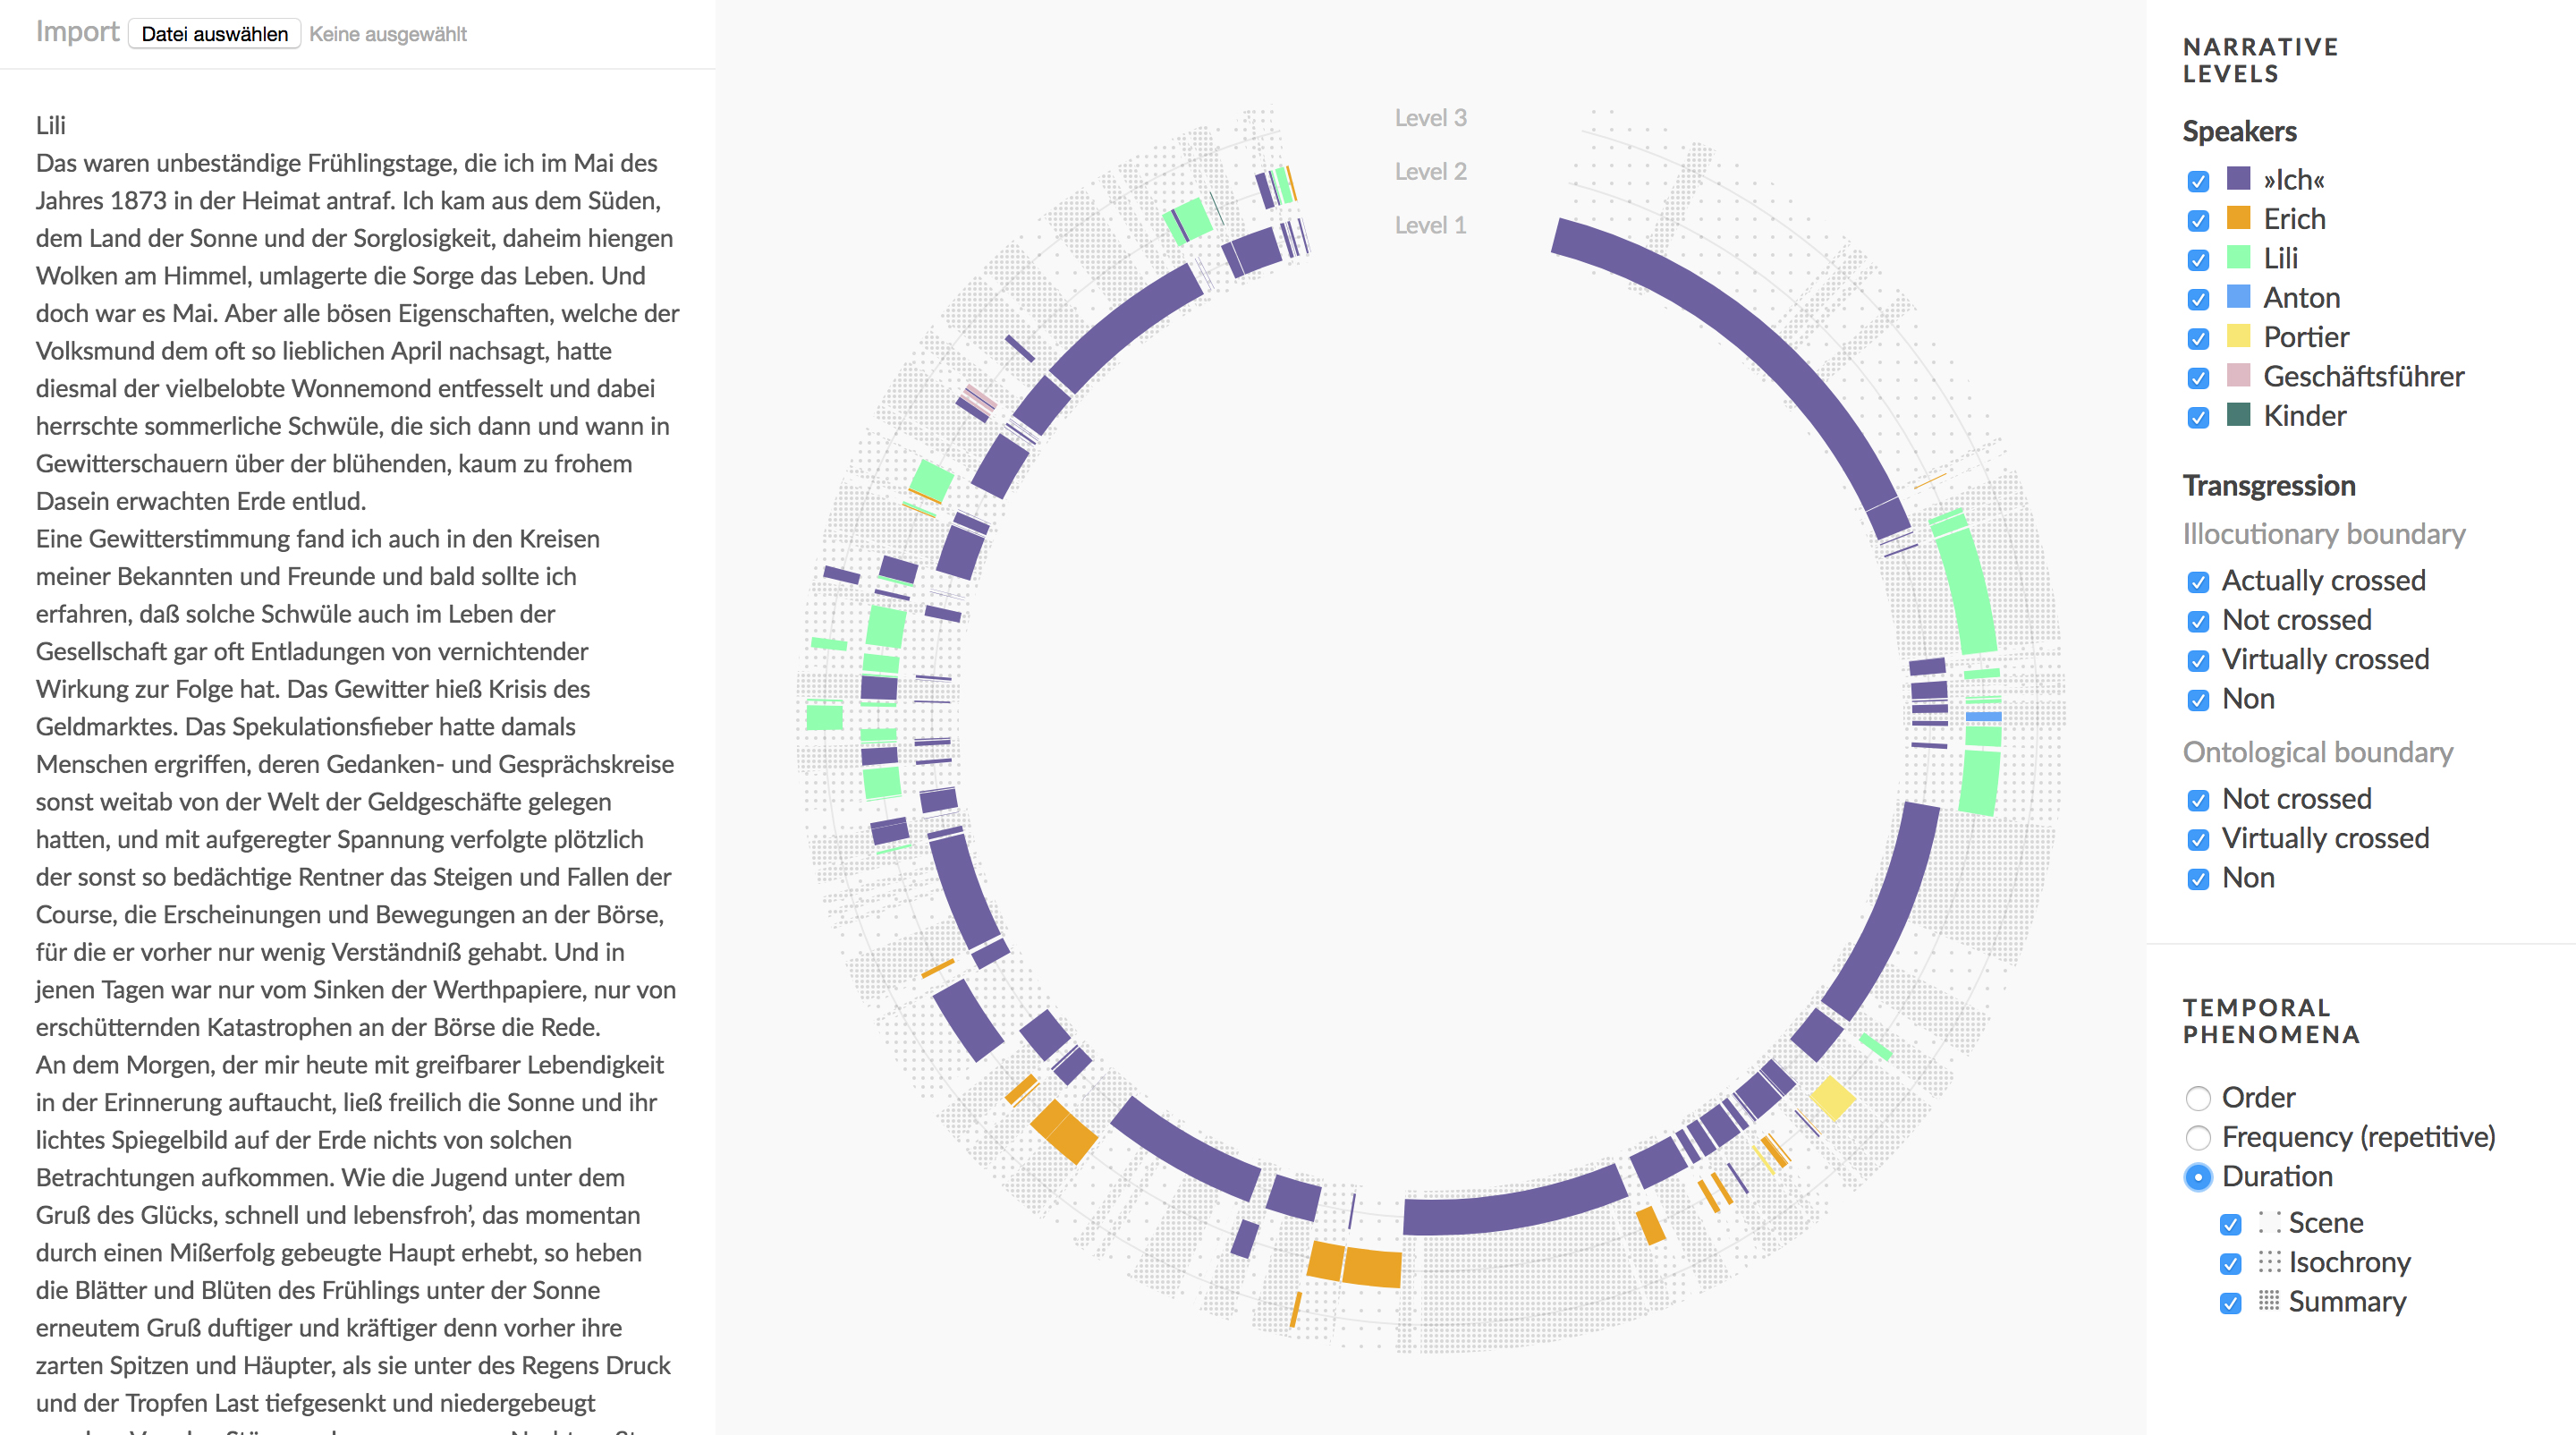
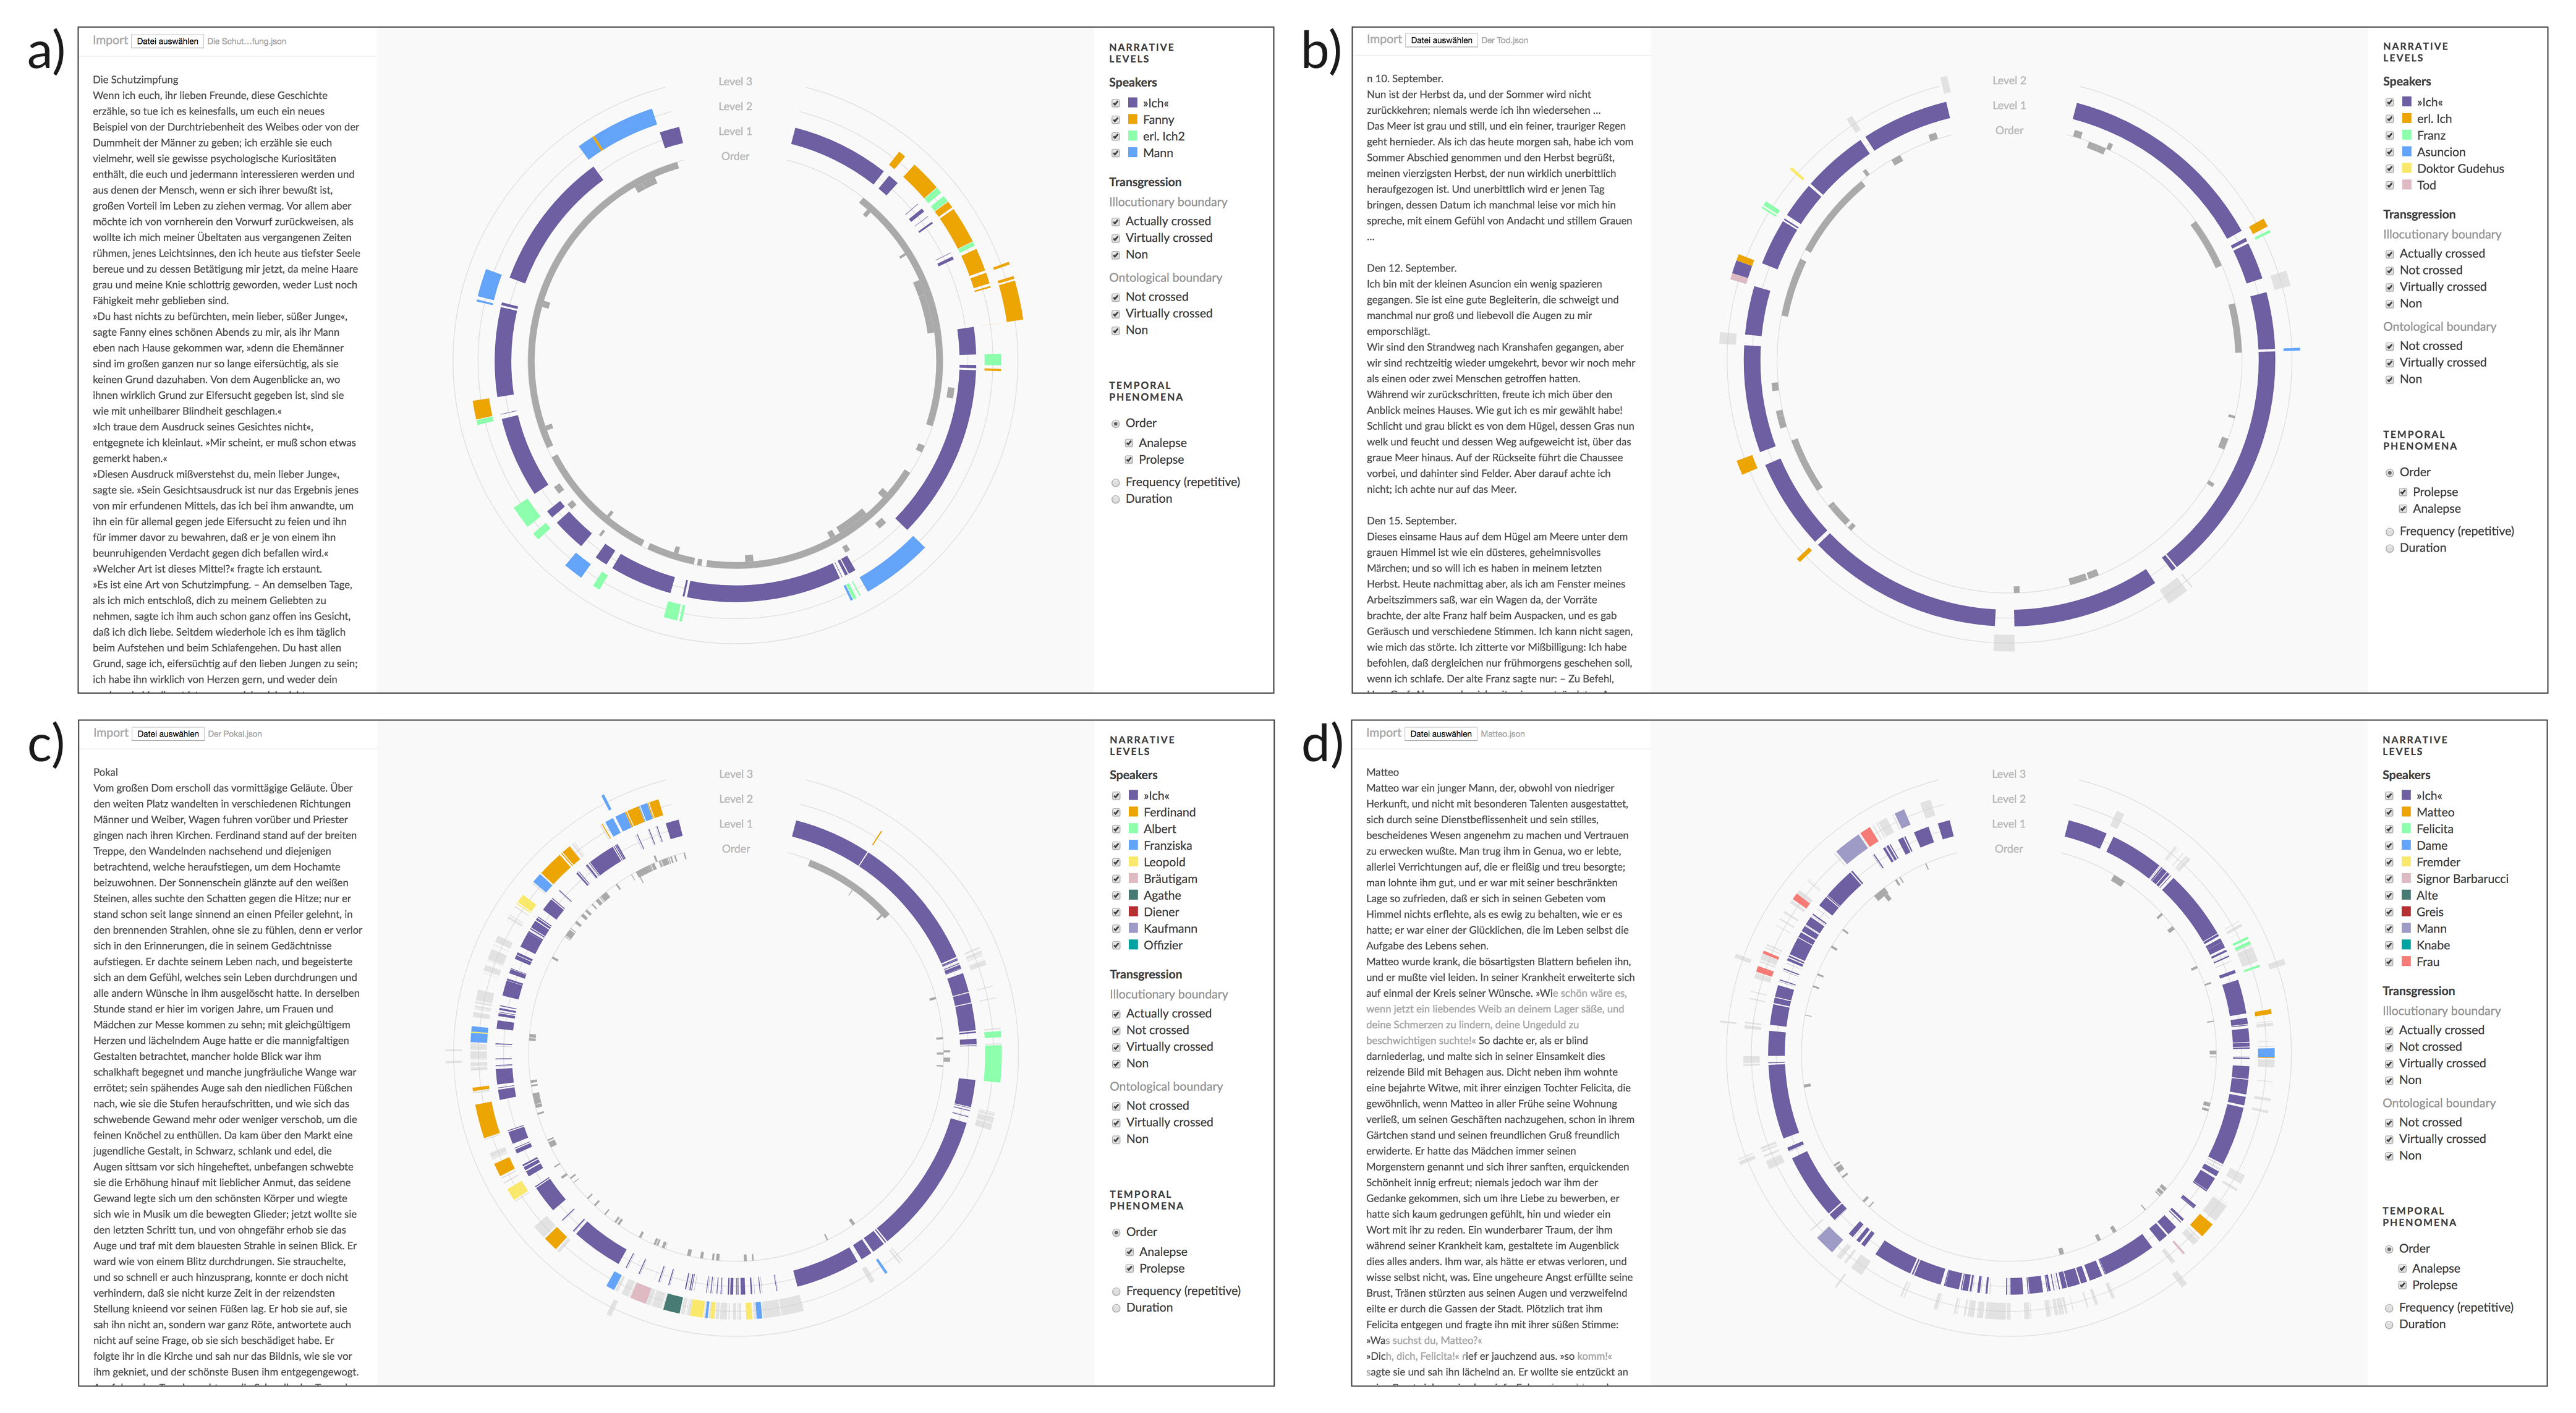
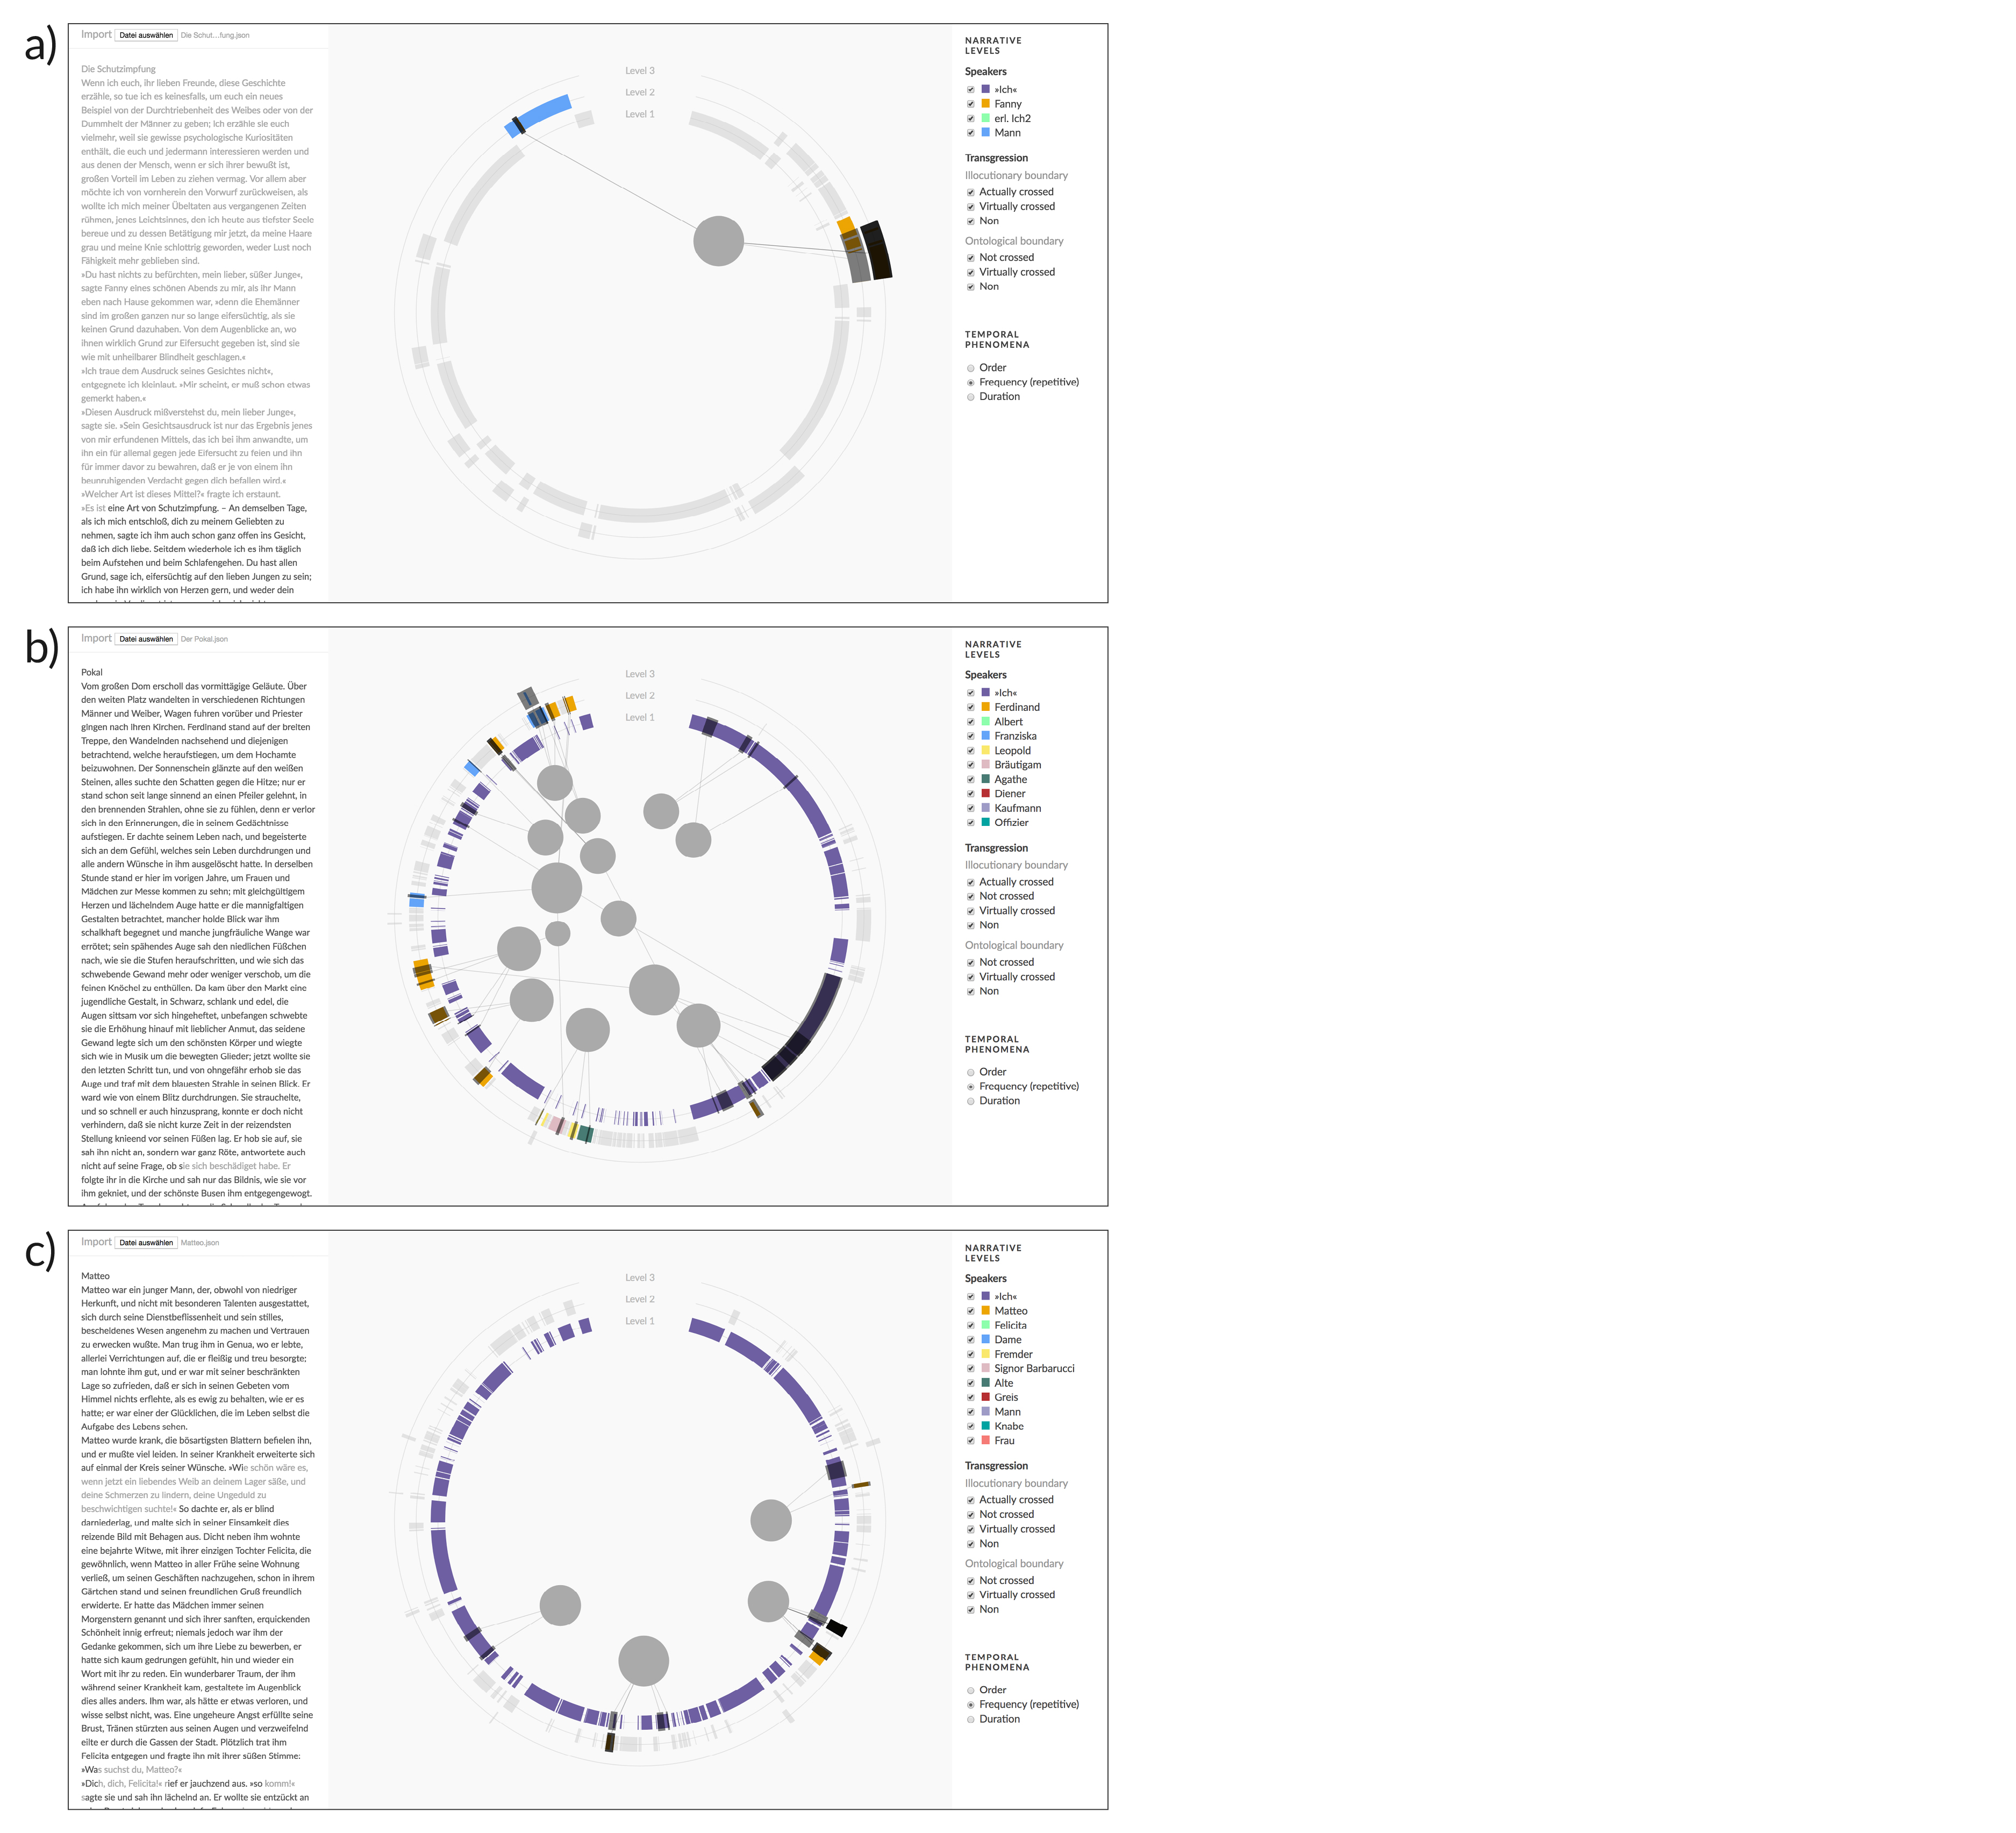
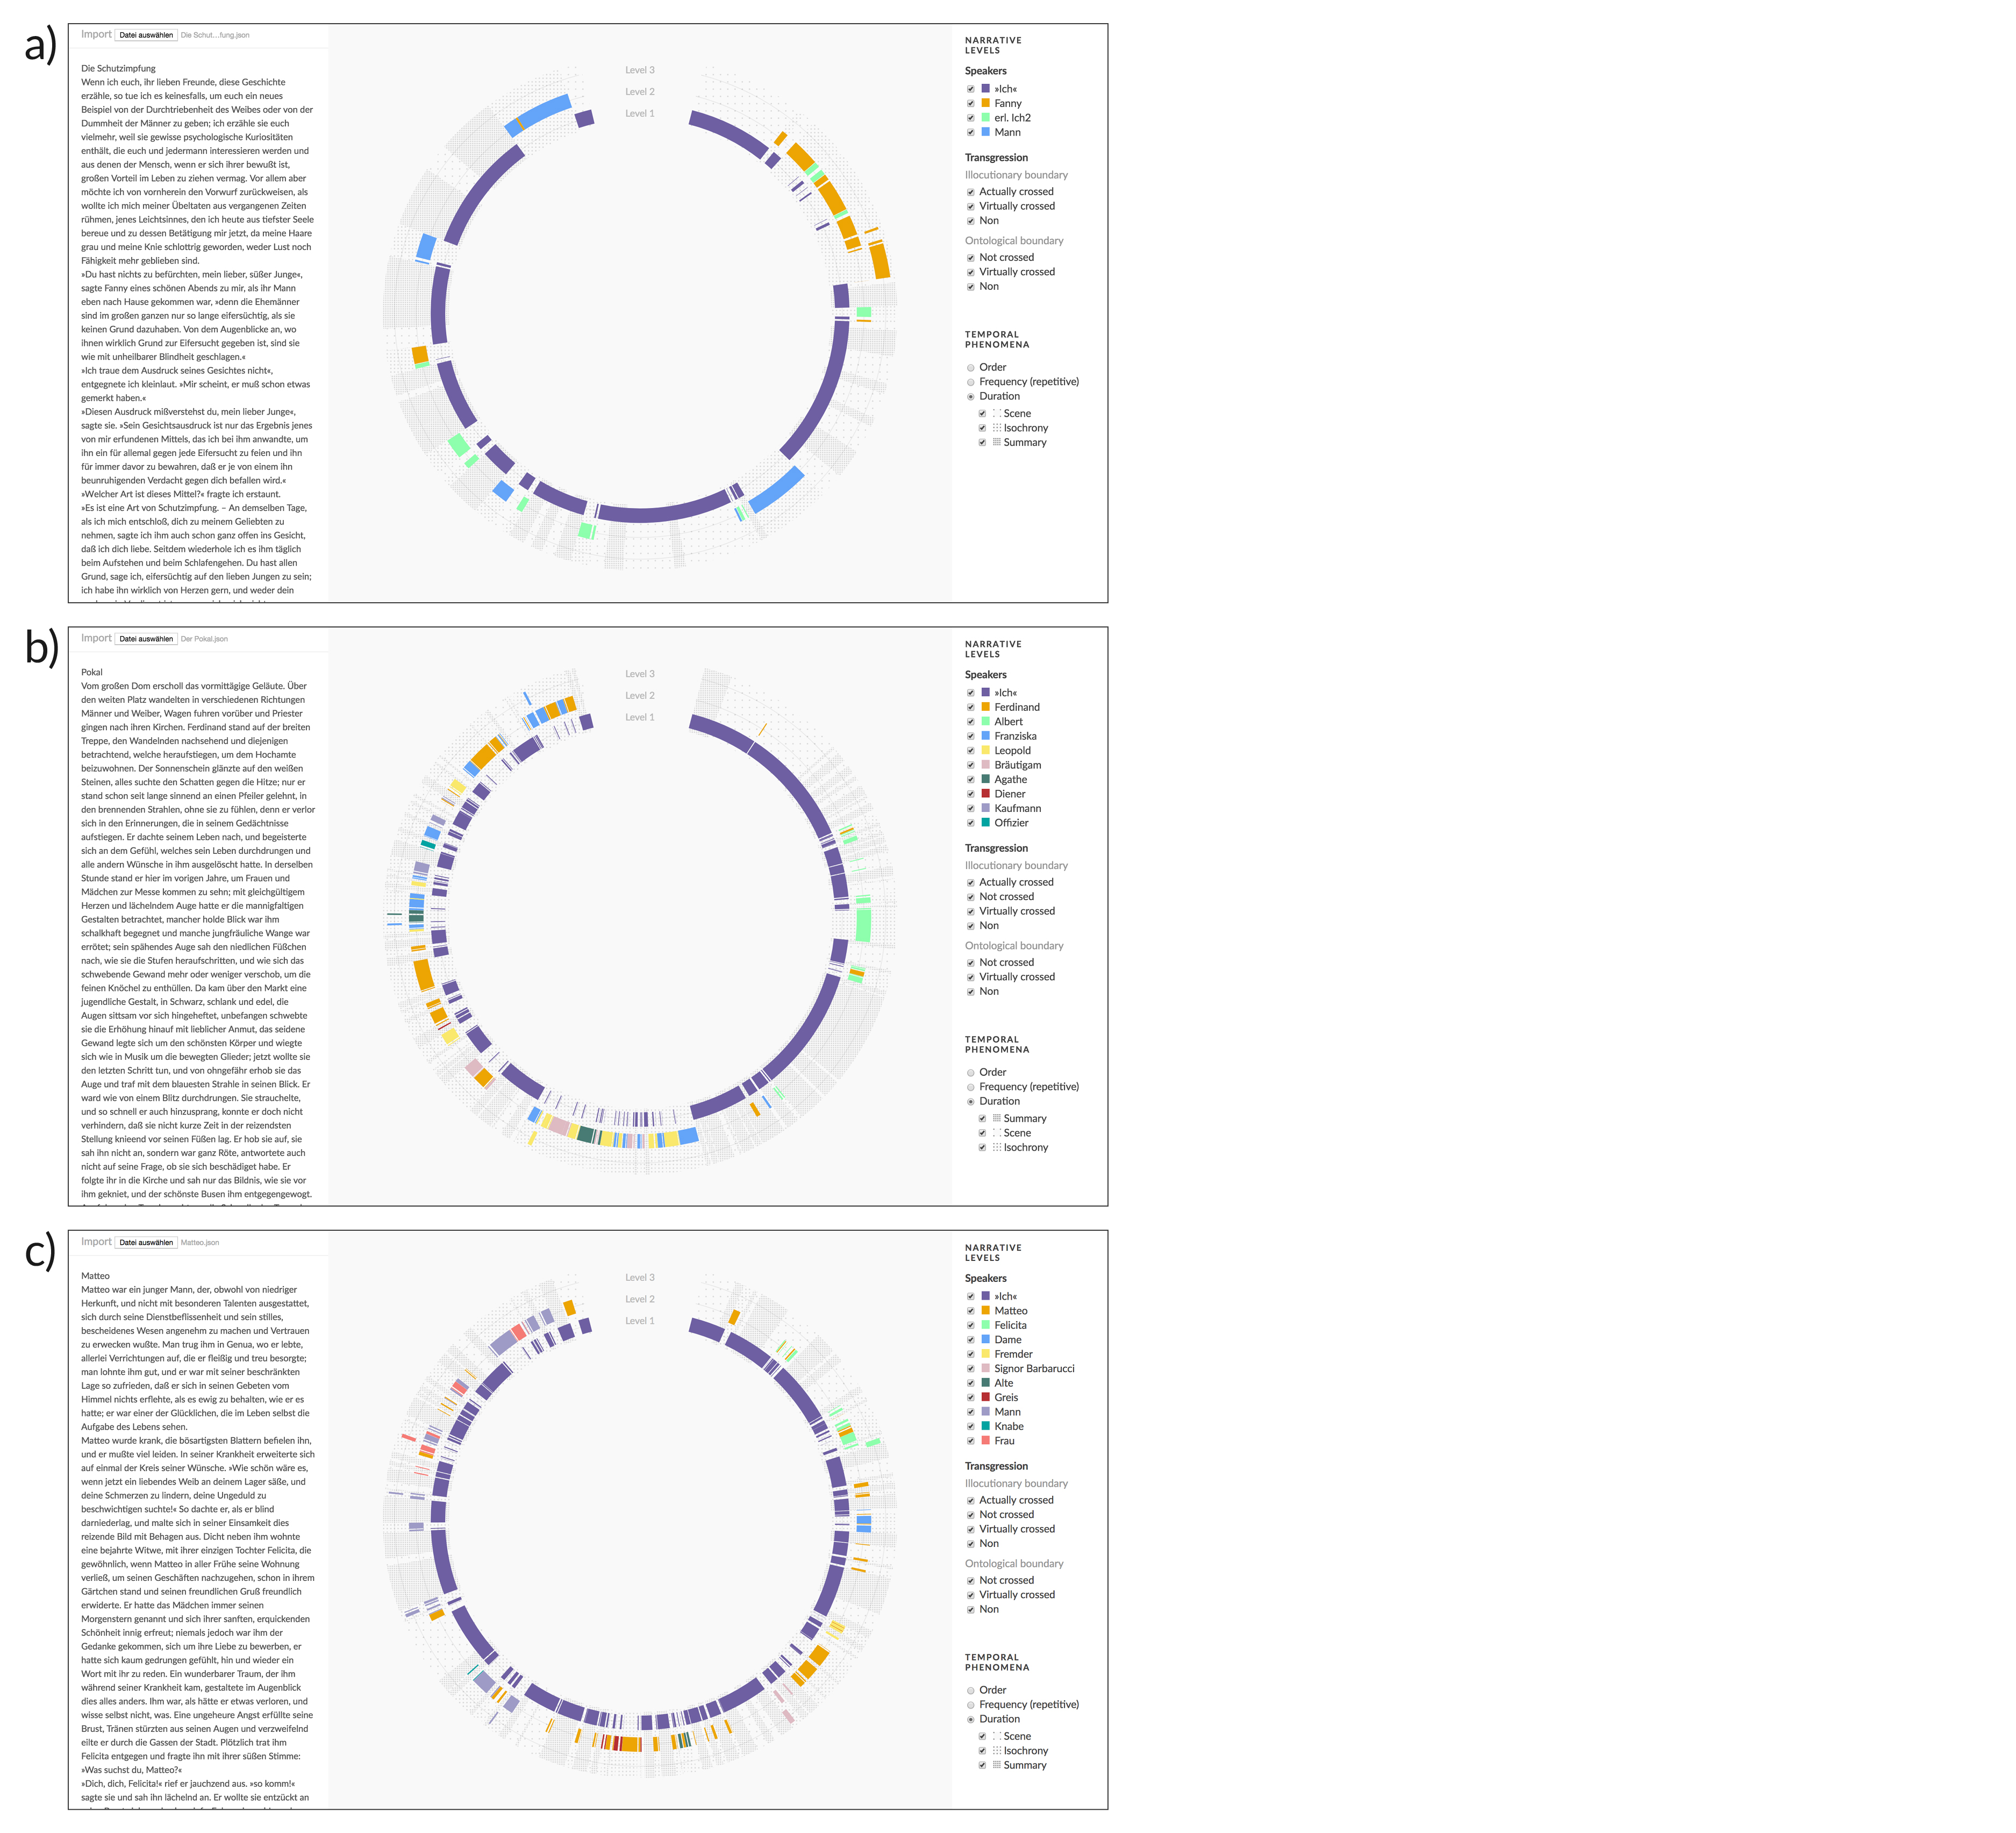
  2. There are a number of potentially interesting questions concerning the correlation between narrative levels and temporal aspects: (a) Analepses (“flashes back” in time) and prolepses (“flashes forward” in time, [Genette 1980, 40] can either be presented by a primary narrator who thus deliberately holds an organizing function – or the primary narrator can “delegate” the navigation through time to secondary narrators. (b) In the case of repetitively narrated events, it can be useful to analyze whether these reports can be attributed to the same narrator or whether different narrators contribute their perspective on the relevant event. Also, if the different accounts of the same event are distributed across narrative levels, it might be interesting to check whether accounts on deeper embedded levels – due to their being mediated “around several corners” – are less reliable. (c) As for the analysis of duration, it might be a worthwhile task to explore whether there are significant occurrences between embedded narrative levels and either of the three duration categories (isochrony, summary, or scene).

3.4 Collaborative Annotations as a Test Bed for Visualization

To carry out narratological exploration, it is first necessary to find a way of recording or documenting the analysis results. An especially effective way of doing this is via computer-aided, taxonomy-based annotation: With the help of programs like CATMA [Meister et al. 2016], narratological categories can be organized into hierarchically structured tagsets, and a theoretically unlimited number of categories can be assigned to individual text passages. Computer-aided text annotation has the additional advantage that literary scholars are encouraged to read the text very carefully (i.e., close reading). The benefits of annotation can be increased if different scholars are working on them collaboratively: By discussing their annotations – especially in the case of disagreement – the collaborating scholars can refine their annotation decisions, test definitions of narratological categories, and identify relevant relations between different narrative phenomena [Gius and Jacke 2017].
The data we use in this paper is indeed annotation data that was created in the computer-aided, collaborative annotation project heureCLÉA (2013–2016, [Bögel et al. 2015]). The text corpus for the project was constituted of 21 German short stories by different authors from and around the 19th century. The tagset that was used to conduct the annotations [Gius and Jacke 2016] first consisted of basic linguistic temporal categories as well as Genette’s narratological temporal categories, and was soon enhanced to include a subtagset for the analysis of narrative levels as the influence between the two phenomena became obvious in the annotation process.
Concerning the temporal subtagsets used in the project, only the ones comprising Genette’s categories order, frequency, and duration – and only the basic tags corresponding to these categories – are pertinent for the Narrelations visualization. Since these basic tags and their application is rather straightforward, we will not go into further detail here [3]. The annotation schema for narrative levels, however, is more complex and requires further description.
Figure 3. 
The narrative level tagset.
The tagset for the annotation of narrative levels (Fig. 3) comprises five tags defining the degree of embedding (primary narration, secondary narration, etc.). In the rare case that deeper degrees of embedding occur, additional tags can be added. Usually, the narrative text as a whole is annotated with the primary narration tag. Whenever, within a primary narration, a passage constituting an embedded narration occurs, it is annotated as secondary narration, etc. For example, in Frank Wedekind’s Die Schutzimpfung, the primary narration (Fig. 4, gray underline) is conducted by a homodiegetic narrator. After a short introduction, a secondary embedded narration (salmon underline) occurs.
Figure 4. 
Annotating narrative levels (as displayed in CATMA).
Each tag of the narrative levels tagset, starting from secondary narration, includes two predefined properties (illocutionary boundary and ontological boundary), each with three possible values (actually crossed, virtually crossed, not crossed). These properties and values are used to document the type and mode of boundary crossing that constitutes the new narrative level. For example, the first embedded narration in Die Schutzimpfung is constituted by one of the narrated characters, Fanny, becoming a narrator. As can be seen in the bottom right area (Fig. 4), the value for illocutionary boundary is set to actually crossed since Fanny functions as embedded narrator and is directly quoted, and the value for ontological boundary is set to not crossed since Fanny’s utterance concerns the same world as the primary narration.
Every text was annotated by at least two annotators in the course of an iterative process [Gius and Jacke 2016, 6–9] – the annotated corpus can be accessed online [Gius et al. 2017]. While the task of developing an automated annotation functionality from the annotation data yielded fruitful results,[4] the narratological analysis data created in the project has not yet been evaluated to find out more about the texts of the test corpus in the context of interpretations. The visualization presented in this paper paves the way to tackle this interesting task.

4. Visualizing Narrative Levels in Correlation with Temporal Phenomena

Narratological analysis poses an intriguing research area for information visualization as it requires the examination of a dataset at multiple scales and from multiple viewpoints. Building on the specific practices of literary scholars who pursue narratology and the particular data structures involved, we aim to conceive a visualization technique that is specifically suited for narratological analysis, i.e., it enables the informative examination of narrative levels along multiple analytical categories in relation to multiple temporal phenomena. Building on the preceding domain characterization of narratological analysis, we hope to address the following specific design goals:
  1. Create overview of narrative levels. A visualization designed for narratological analysis should primarily provide an overview of the nesting and distribution of narrative levels forming the essential structure of every story. Facilitating access to this complex narratological topic through visual representation may provide new insights into the mechanisms of storytelling and show hidden patterns to literary scholars.
  2. Reveal temporal aspects linked with narrative levels. An important aspect of nested narrations in stories is their temporal order, frequency, and duration in relation to the events they narrate. Scholars of narratology need to inspect the correlations between the narrative levels and temporal phenomena to perform the appraisal of the multi-layered structures of narration in stories. The integrated representation of narrative levels and temporal aspects may foster a deeper understanding of narrative structures.
  3. Couple visual analysis with text reading. The high-level analysis of an entire text through the use of visualization (distant reading) should be as integrated as possible with the close inspection of specific text passages (close reading). The visualization should support the scholar to shift between these modes of analysis to encourage discoveries of patterns at different granularities.
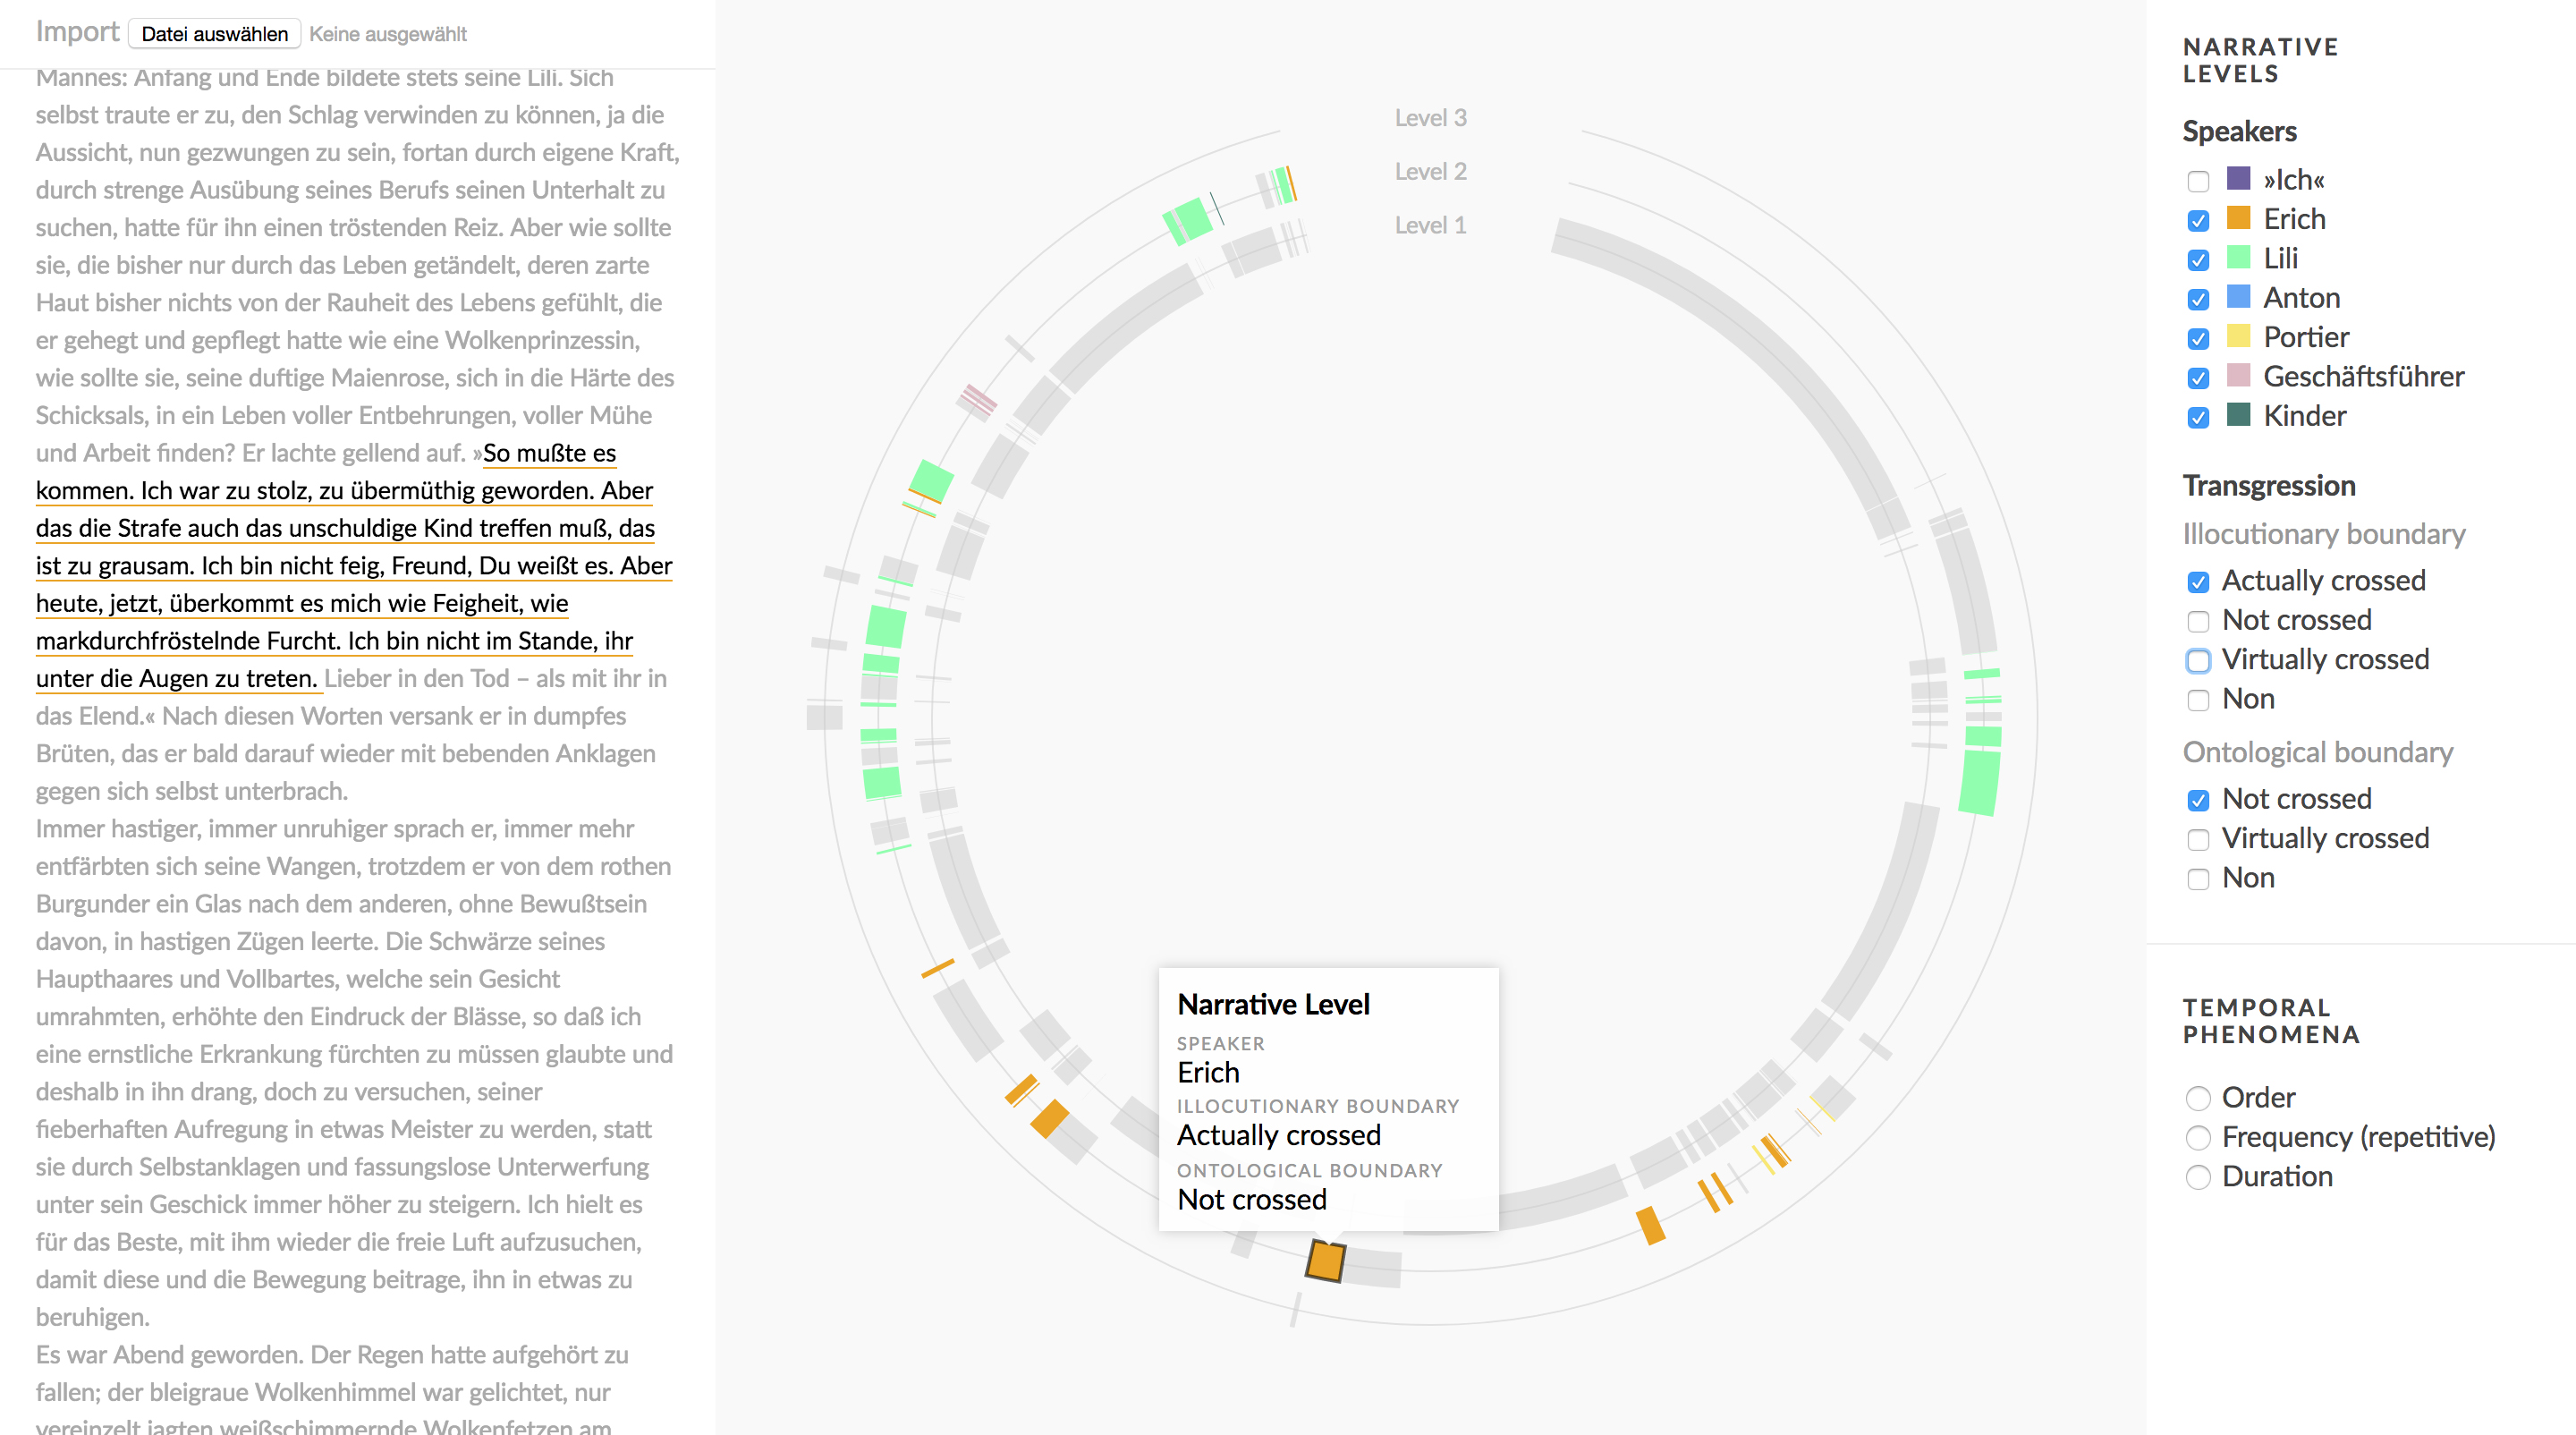
  4. Enable focus on specific annotations. A visualization of multiple structural and temporal aspects of narrative levels may be visually complex and overwhelming. In order to support the focused analysis of specific narrative phenomena, interactive mechanisms should be provided that allow for the filtering of annotations along meaningful narratological categories.
These design goals (DGs 1–4) provide a set of guiding principles for an iterative and collaborative design process carried out in an interdisciplinary team consisting of interface designers, visualization developers, and literary scholars. Next, we summarize the design process, after which we present the resulting visualization and the findings from a usability test.

4.1 Design Process

The entire research approach and design process – from devising initial visualization ideas and refining design concepts to developing a functional prototype and evaluating the epistemic potential of the resulting visualization – was iterative and collaborative. Since our aim was to develop a visualization suitable for narratological analysis, a fruitful exchange of knowledge ensued between visualization research and literary studies. The process was also characterized by the constant interplay of designing and evaluating visual representations.
Figure 5. 
First sketches and visual approaches dealing with the topic of narrative levels suggest a circular layout for nesting and relating different narrative levels.

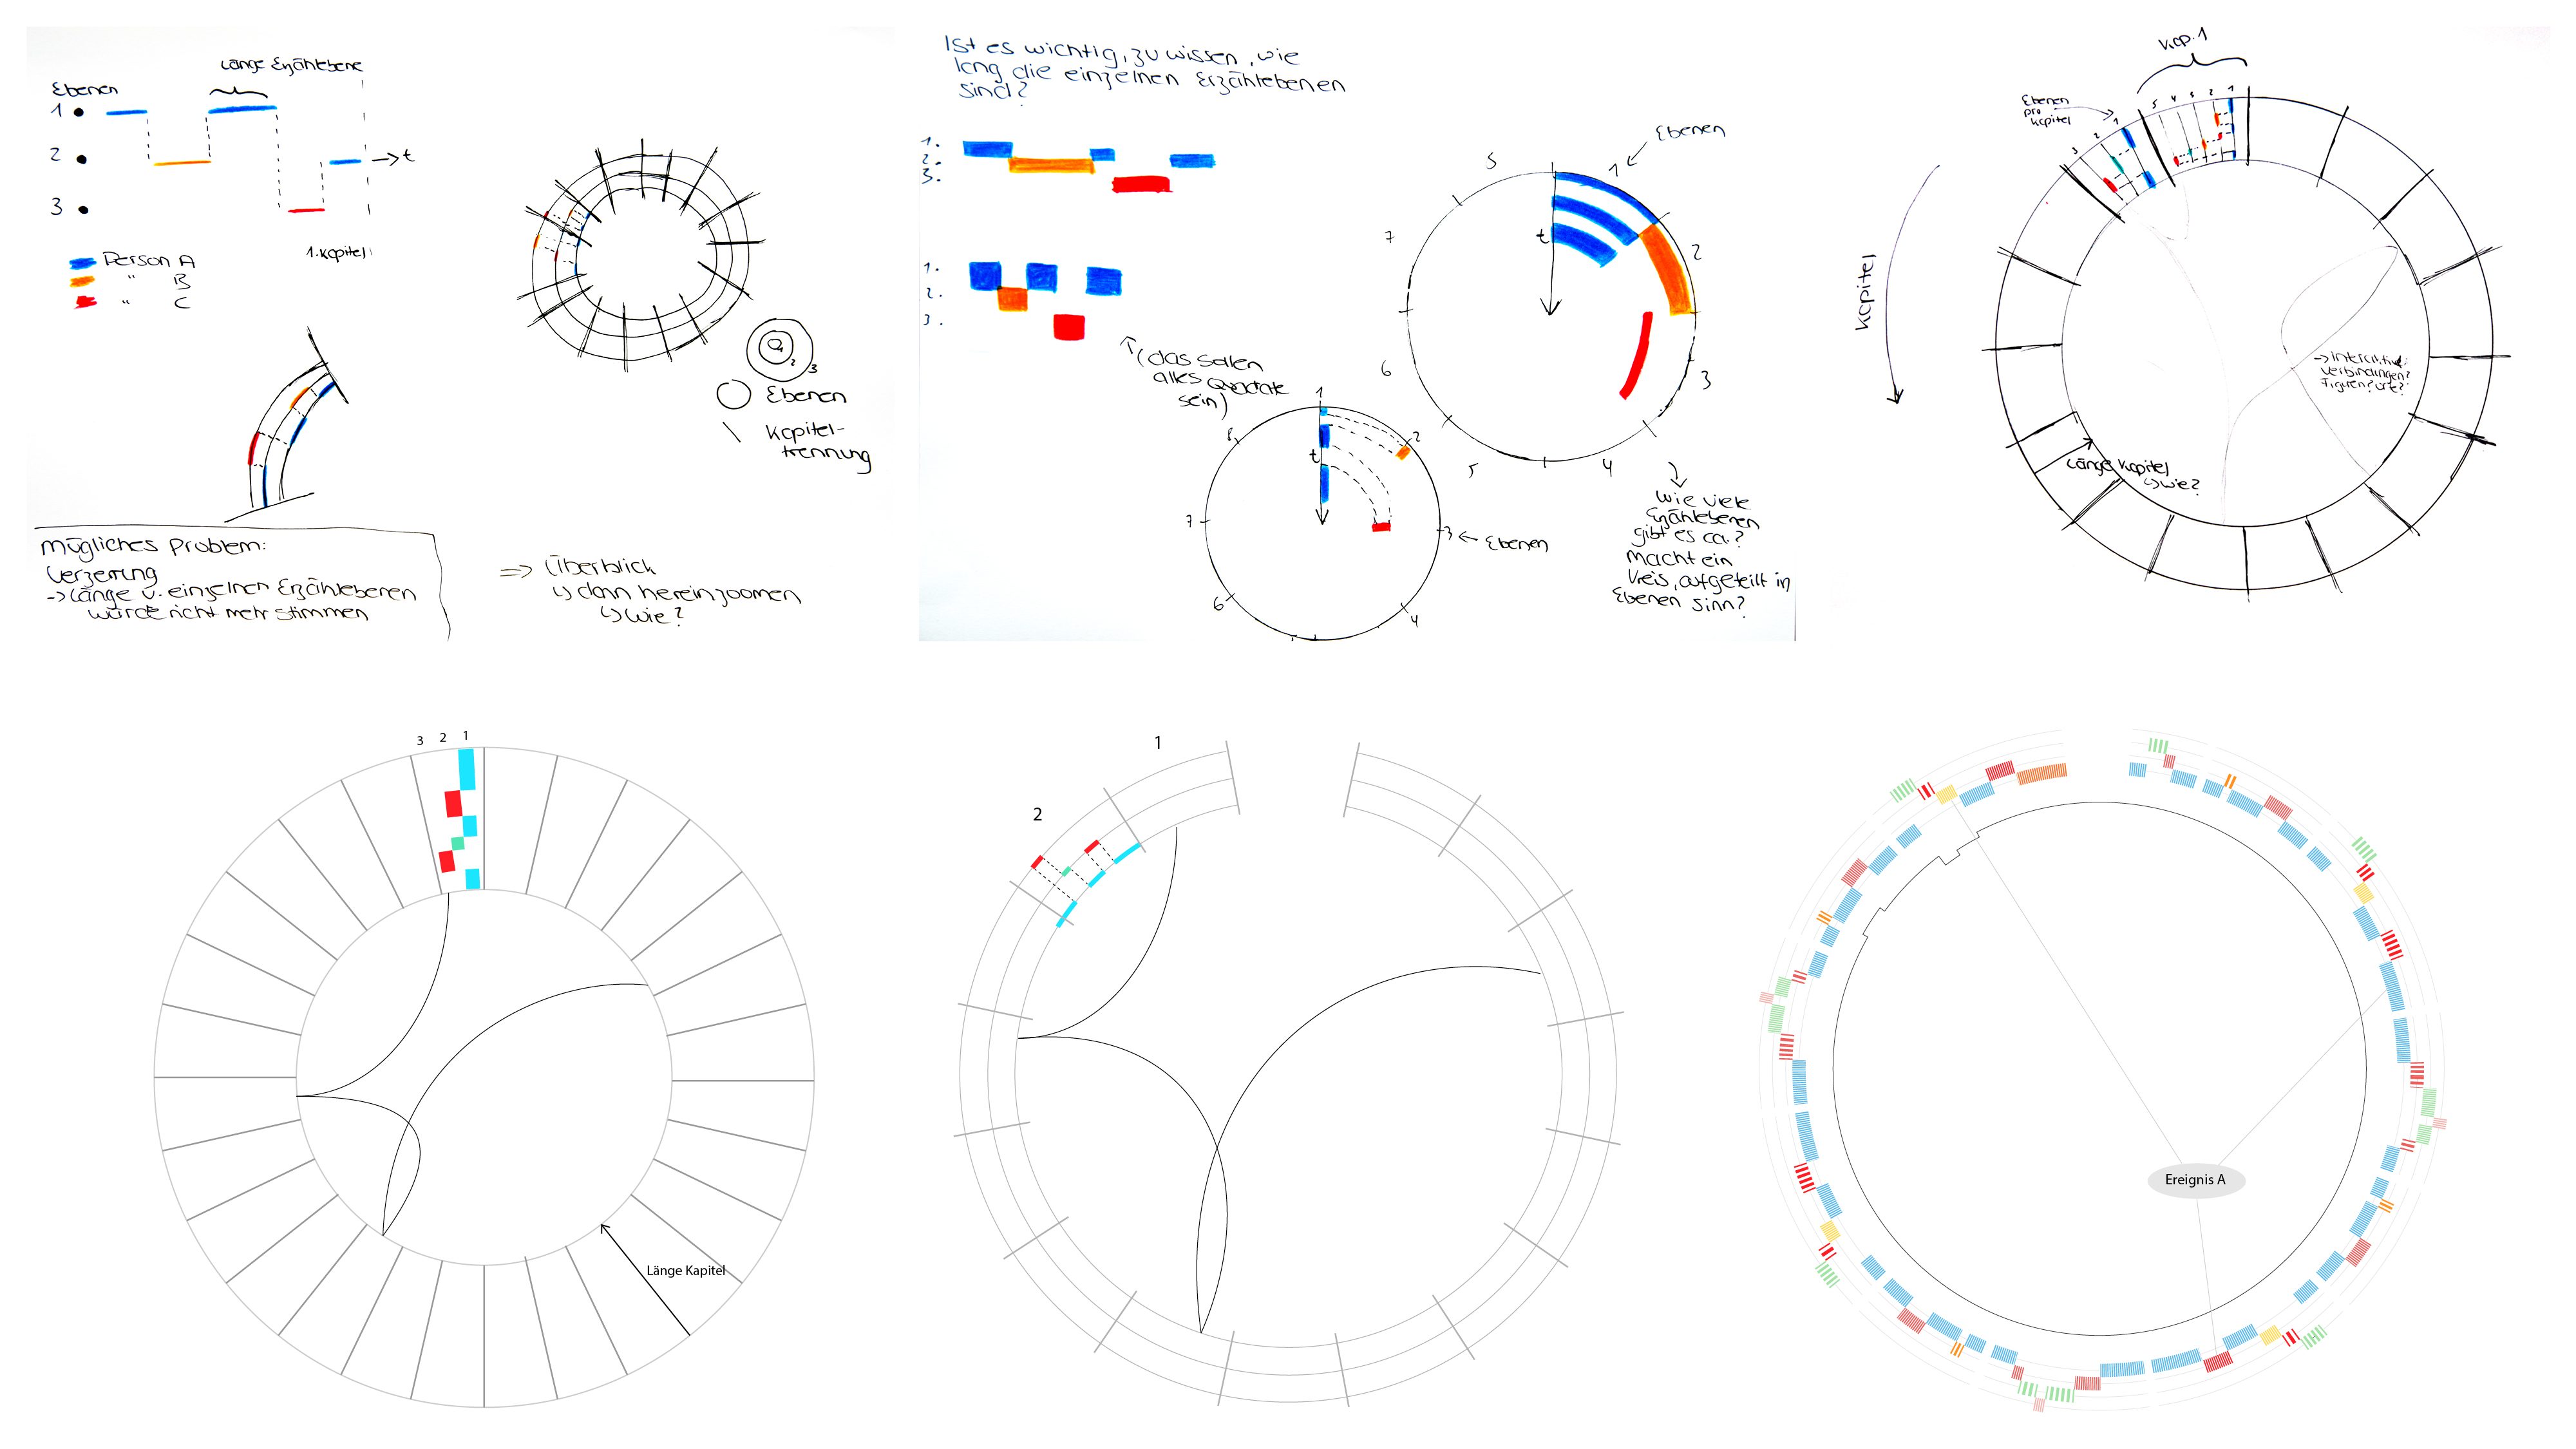
4.1.1 Speculative Sketches

Due to the complexity of narratological analyses of literary texts we set up a co-creation workshop [Sanders and Stappers 2008] bringing together students and researchers of design and literature. The aim was to encourage participants (incl. ourselves) to approach and examine stories in unconventional ways that go beyond the linearity of printed text and the rigidity of existing text analysis software. A range of crafting materials and tools (such as threads, stickers, paper sheets, Post-Its, pens, glue etc.) was provided to creatively work with printed texts and arrange them as figured fragments into collages or sketches. In this way, we used visual means of low complexity to devise and discuss abstract ideas and approaches to narrative. While the main categories of narratological analysis provided an important backdrop for this exercise, we avoided thinking too specifically about designing an interface. Instead, the aim was to create a casual approach to the complex topic of visualizing literary narratives, to tease out new ideas and perspectives in a visual way, and to gauge the potential for visual representations of text. During the presentation of the first “speculative sketches” (see Fig. 5), the initial feedback suggested that the circular form of the visualization could support the examination of narrative levels in combination with temporal aspects.
Figure 6. 
Further development of concept sketches based on provided annotations of the short story Lili.

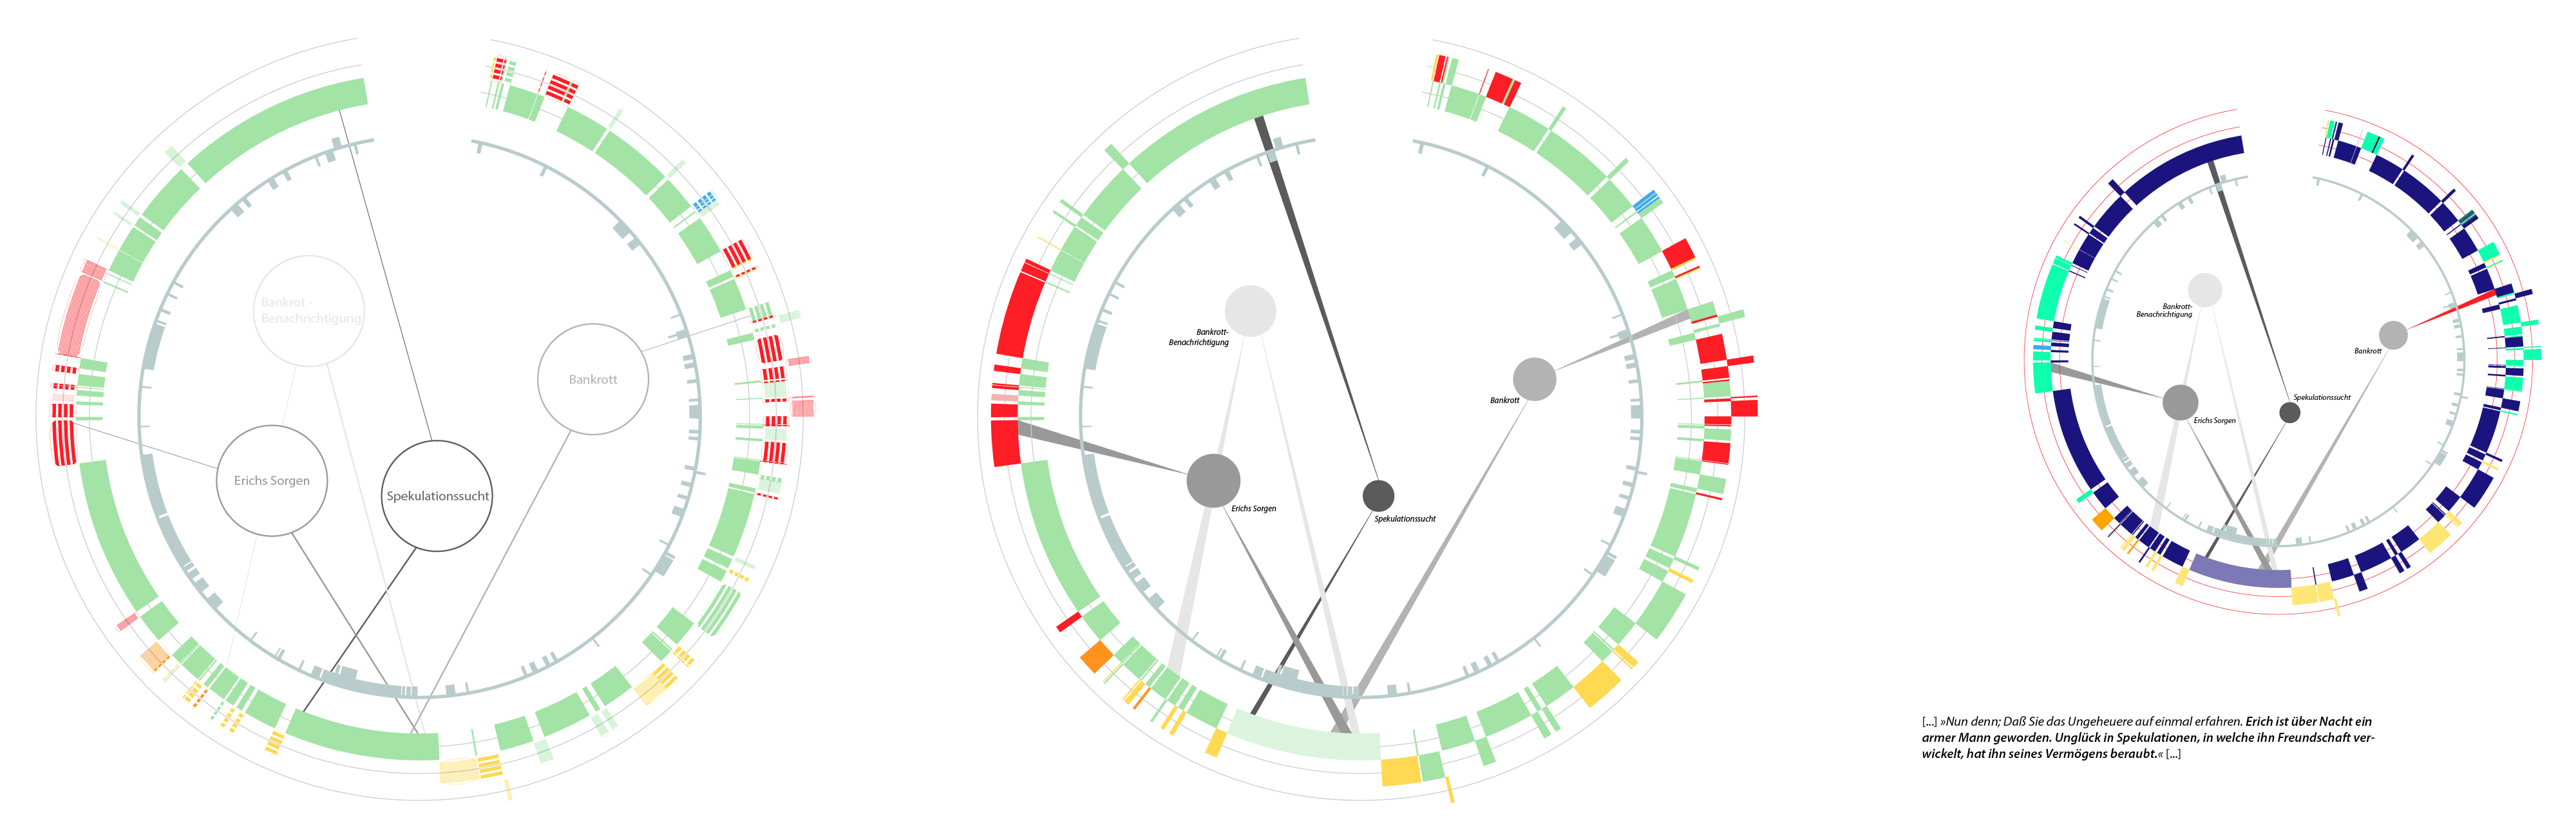
4.1.2 Plausible Mock-Up

By providing the annotated short stories of the heureCLÉA project it was possible to develop a visualization design that relied on actual data (see Fig. 6). To start working with a specific text, we chose the short story Lili by the German author Johannes Proelß (1883), with which we continued working on throughout the next steps. With specific attention to the narratological concepts, we further developed the design concept and visual encoding, which was followed by feedback including suggestions for modification and improvements from a literary point of view, which was again followed by a revision and adaption of the design.
Figure 7. 
Screenshots of animations demonstrating the interface and general interaction capabilities.
In further steps, the focus was put on developing interaction capabilities for the visual implementations of the narratological concepts. In order to devise and explore different interaction capabilities we created animations demonstrating them and the subsequent display changes (see Fig. 7).

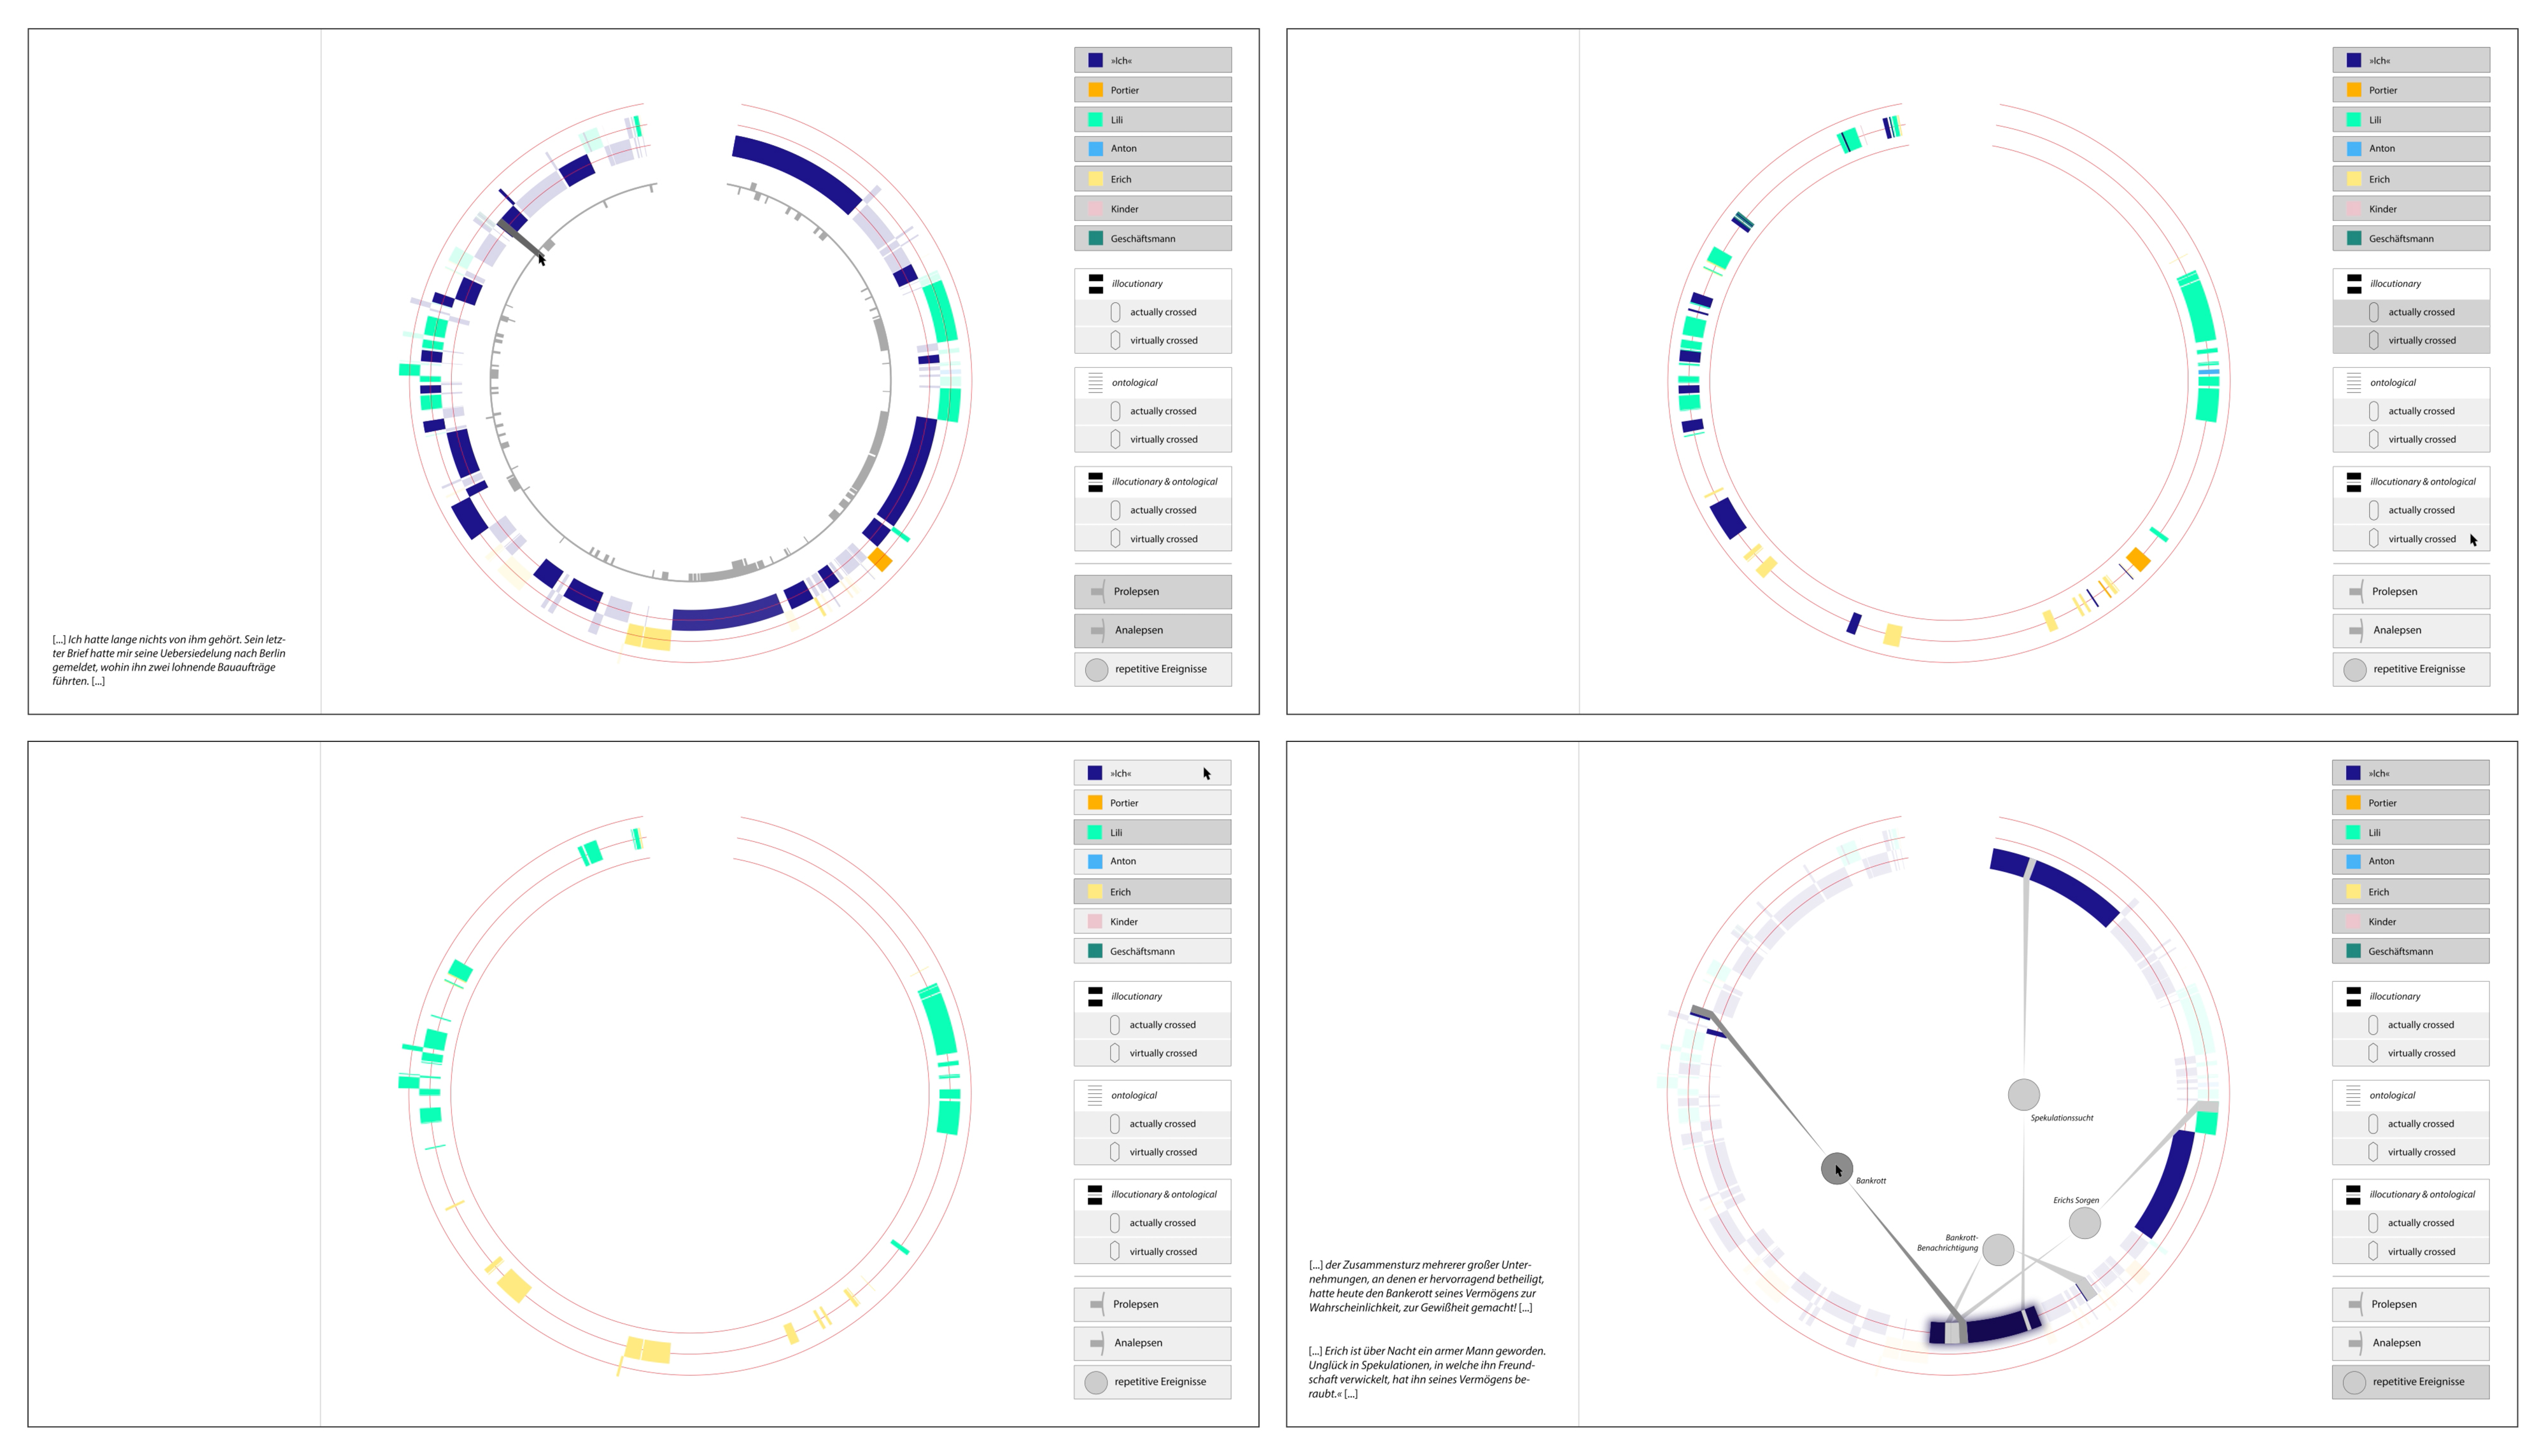
4.1.3 Functional Prototype

Following positive expert evaluations from the literary scholars of the team, the next step was to develop a web-based prototype in order to visualize different data sets (i.e., annotated stories), refine the interface and interaction capabilities, and more extensively test the potential of the visualization. Furthermore, the prototype allows for a narratological comparison of several short stories, which will be discussed in detail in section 5.

4.1.4 Usability Evaluation

To better understand how comprehensible and accessible the visualization would be for other literary scholars beyond our team, we conducted a usability test with an external group of potential users. A usability test helps to uncover issues, which can subsequently be analyzed to identify their causes and inform the refinement of the interface. We performed the test with five researchers and students in literary studies and one cultural scholar. After a few questions about the participants’ professional background and a brief explanation of narratological concepts, the main part consisted of the participants’ description of first impressions of the tool and nine tasks to be solved with the help of the interactive visualization. We used the thinking-aloud method [Lewis 1982], during which participants articulate their actions, thoughts, and opinions aloud while using an interface. After the test, we requested more information from the participants about their experiences and the problems during the test in the form of a semi-structured interview and questionnaire. The participants shared general feedback about the overall concept behind the visualization as well as specific suggestions for improvement. The main statements of the feedback were documented in written notes and the screen activities and the audio were recorded. We analyzed these observations by organizing them into different categories (e.g., wording, interaction, visual encoding, interface design) and subject areas (e.g., overall arrangement, text area).

4.2 Visual Encoding and Interaction Capabilities

Figure 8. 
The interface consists of a text area (left), a set of filters (right), and a circular visualization representing narrative levels and temporal phenomena (center).
The interface of the Narrelations visualization is subdivided into three main areas: text, visualization, and filters (see Fig. 8). The text area on the left side provides access to the entire story in a scrollable area. In order to load in other short stories, an import function above the text area is embedded. On the right side, a set of filters allow for the selection of specific narrators and narratological categories. In the center of the interface, a circular visualization of the text represents the two main narratological aspects a given story: the circle lines are used for the representation of narrative levels and the circle interior for the temporal phenomena.

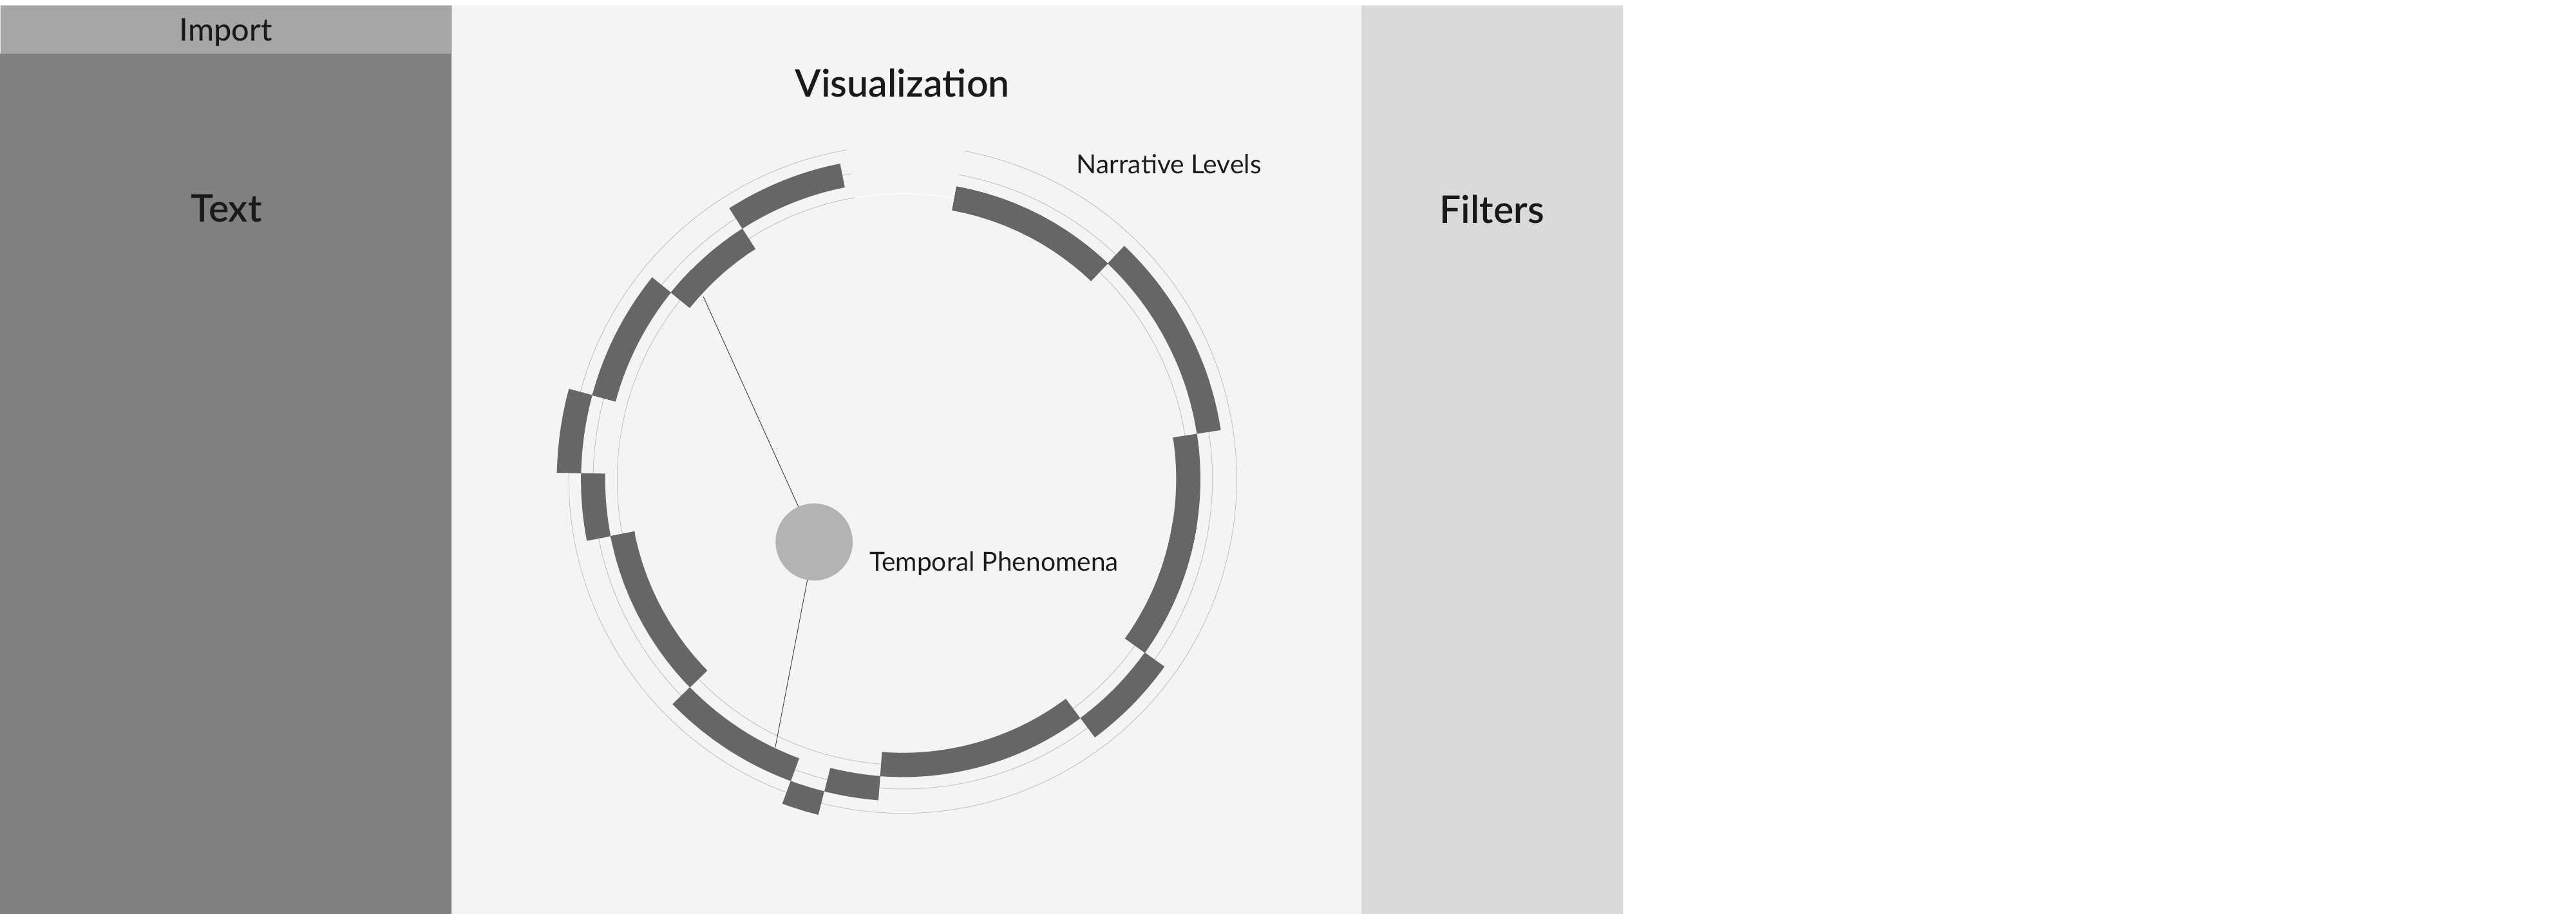
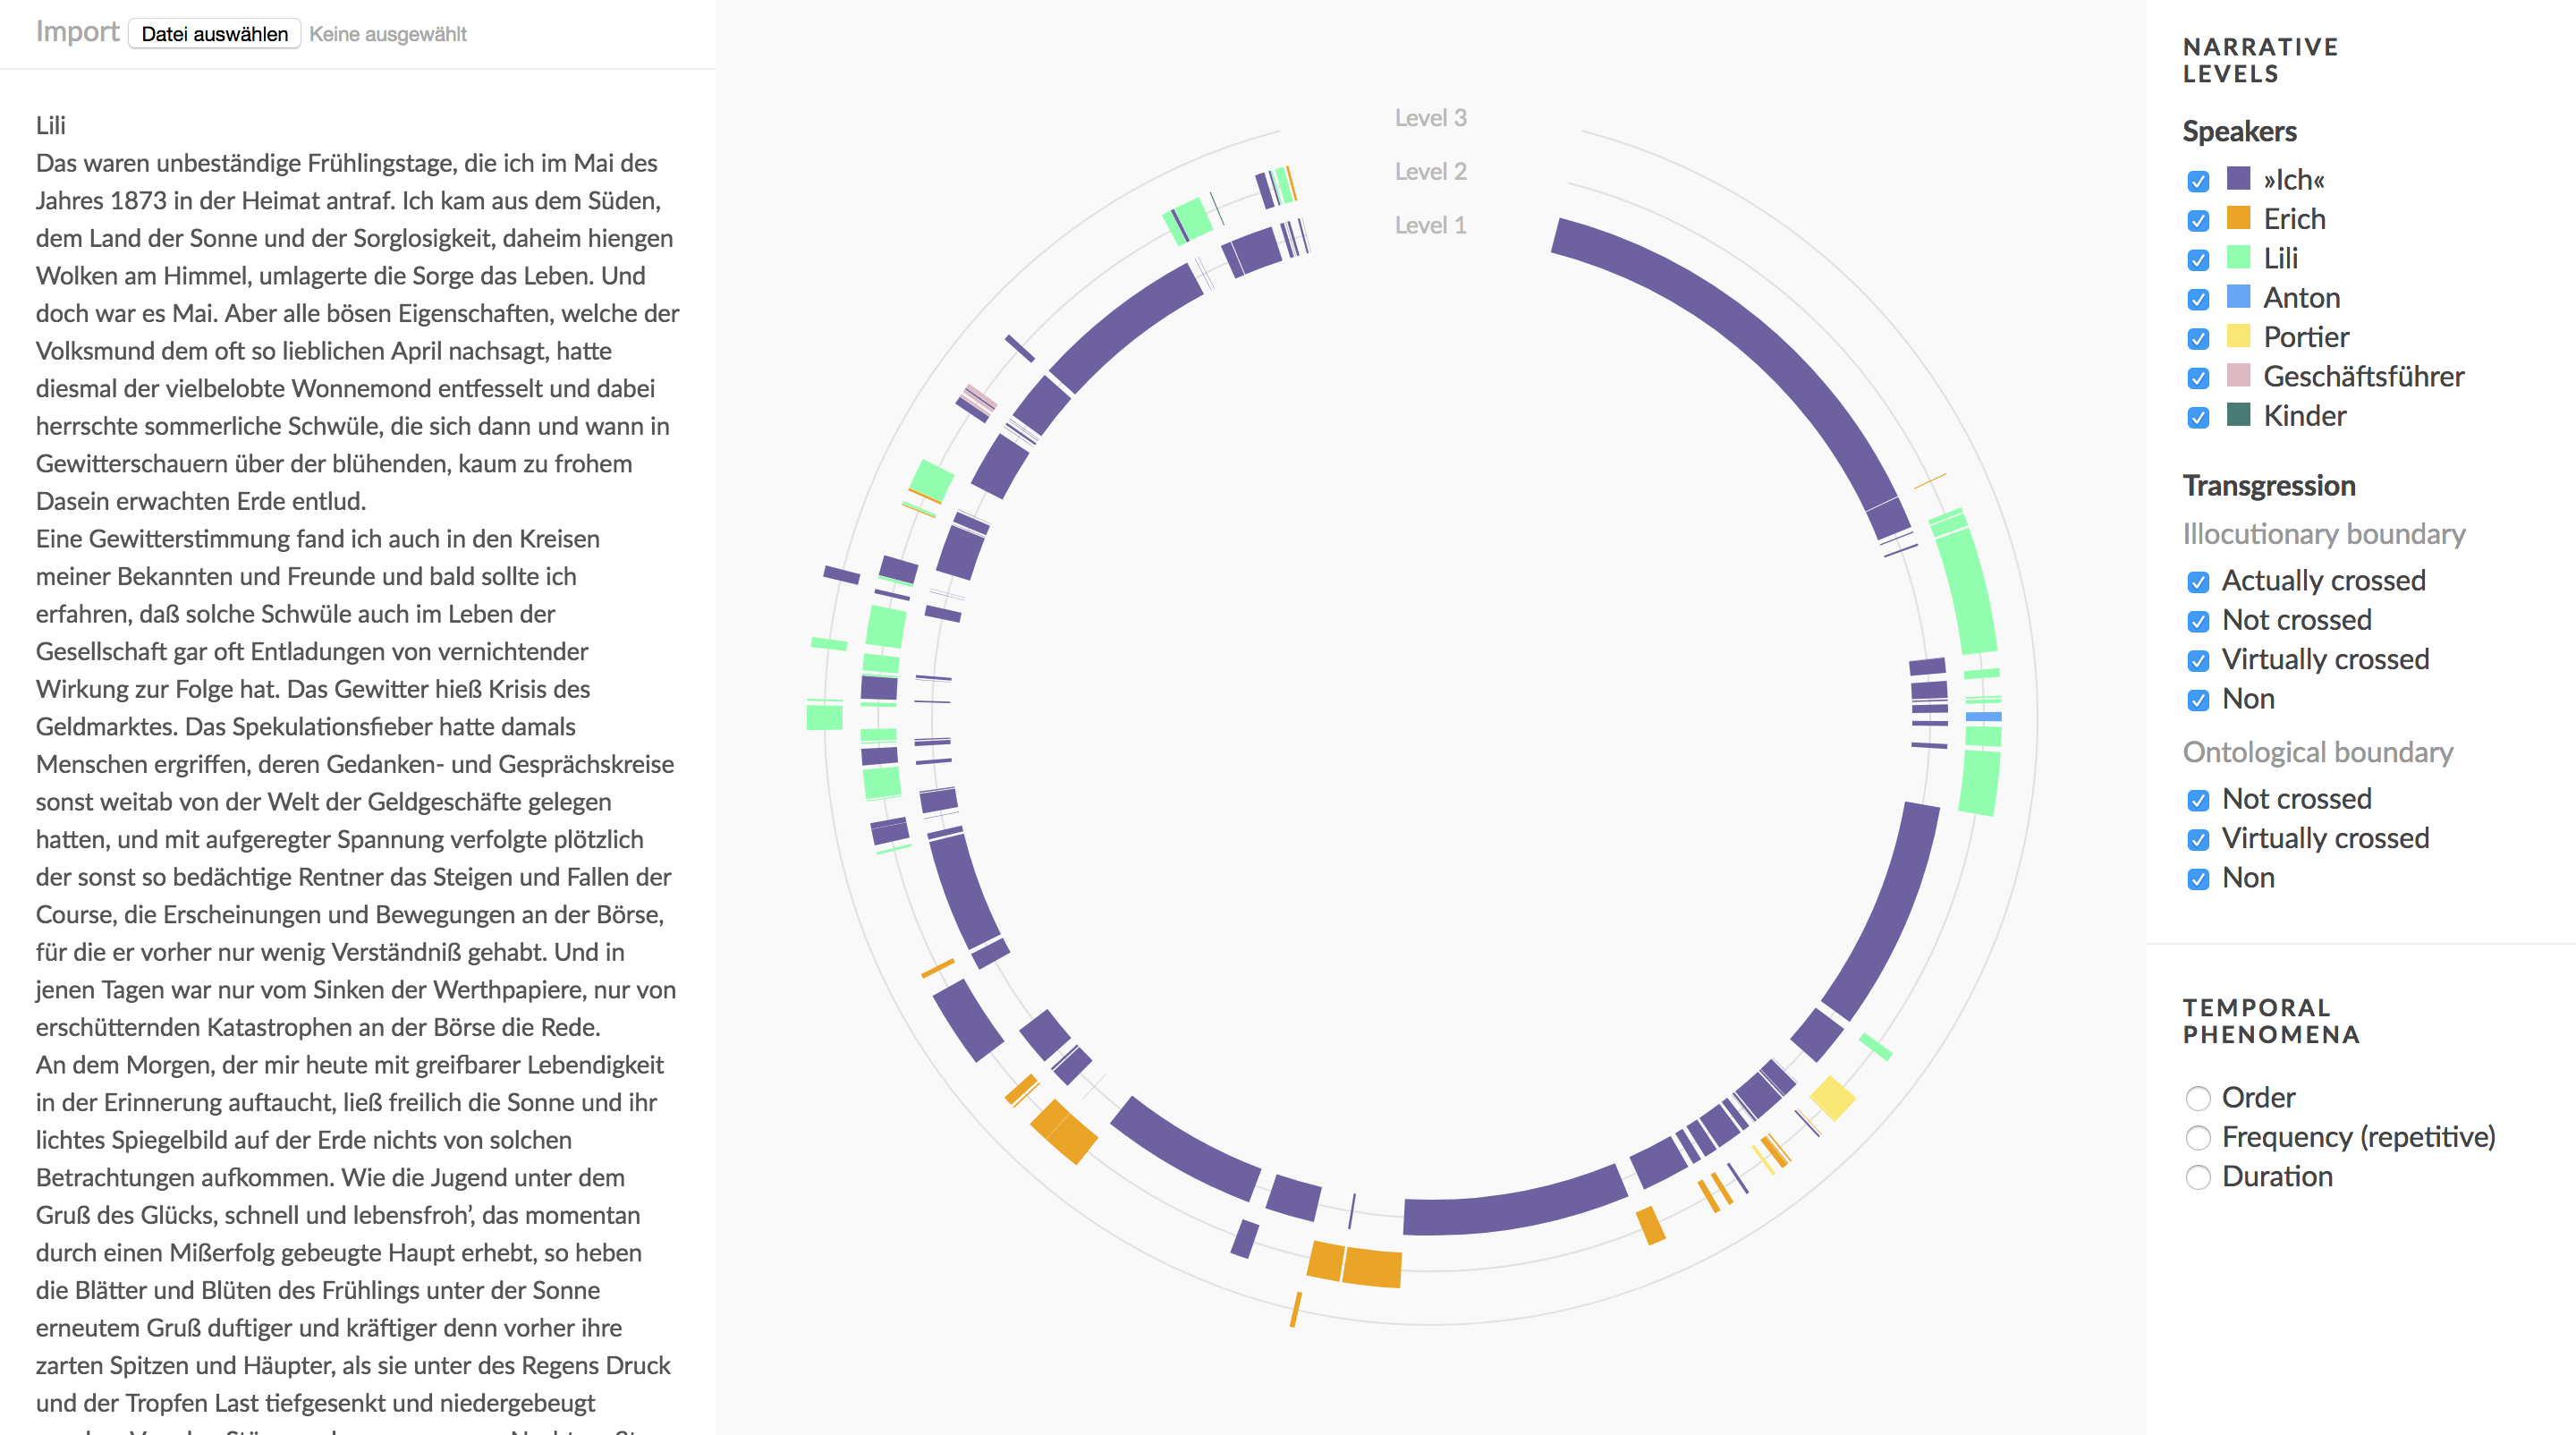
4.2.1 Encircling Narrative Levels and Temporal Phenomena

Since the initial sketches, we explored the viability of a circular representation of the entire text to provide a compact overview of the different narration levels and related phenomena (DG1). This visual structure has repeatedly led to approval and agreement from the literary scholars in our team, in particular due to the ability to display and examine complex temporal phenomena of a story in correspondence with the embedded narrations (DG2).
Figure 9. 
Each circle line represents one narrative level and each thick and colored element on the lines indicates one embedded narration segment. Every speaker (narrator) is displayed in a distinct color. The inner circle line with gray rectangles visualizes the analepses and prolepses.
The visualization is read in clockwise direction. Each circle line represents one narrative level: The inner circle with the many blue elements visualizes the primary narrative level, the slightly larger circle denotes the secondary narrative level, and so forth. Each colored element on the these circle lines represents one embedded narration segment (see Fig. 9). The length of one colored element is to scale to the length of the embedded narration (unit: characters). Each color represent one particular speaker. The list of speakers in the filter area is doubling as a legend showing at a glance the number of speakers. The interior of the circle provides space for the examination of three temporal aspects: order, frequency, and duration.
The inner circle line with gray rectangles represents the temporal phenomenon “order.” Rectangles pointing outwards indicate prolepses (“flashes forward”), rectangles pointing inwards the analepses (“flashes backward”). Akin to the embedded narrations, the length of the rectangles are to scale to the length of the respective text segments. By visualizing this phenomenon on another circle line, the connections and correlations between the analepses/prolepses and the embedded narrations can be viewed at a glance.
Figure 10. 
Repetitively narrated events are visualized by bubbles in the circle interior and lines connect them with the embedded narrations in which they occur.
The repetitively narrated events are visualized by small circles (bubbles) in the circle’s interior and lines connect them with the embedded narrations in which they occur. This visual encoding should enable the quick recognition of how many repetitively narrated events exist in the story (see Fig. 10). The size of one bubble demonstrates the number of reports of one repetitively narrated event, the position is determined by a force-directed layout that places the event bubbles closer to the narration segments in which they occur. In addition, a report of a repetitively narrated event is marked by a dark gray, slightly transparent element within the embedded narration. The length of this mark is to scale to the length of the report of the narrated event (unit: characters). Repetitively narrated events are actions that happen once but are told several times within a story. Therefore the highlighting of multiple reports of one event is important for generating narratological insights and again for identifying the relations with embedded narrations.
Figure 11. 
Patterns in a bright gray in the background of the visualization represent the annotations of the phenomenon “duration” (“scenes”, “summaries” and “isochronies”).
The third temporal phenomenon that can be examined in the visualization is “duration”, which is represented as bright gray, fine-grained dot patterns in the background of the circular visualization (see Fig. 11). We encoded different duration categories as the density of the dots. Since the “scenes” are passages in which the time of narrating is longer than the time it took for the narrated events to happen it can be considered as a stretching of time. This aspect of stretching is translated into the visual form of a pattern consisting of dots that repel each other creating a lot of space between them, thus the pattern with the fewest dots visualizes the annotation “scene”. “Summaries” represent a compression of time. Visually translated they are accordingly represented by the pattern with the most dots. The “isochronies” are displayed as a dot pattern with a visual density approximately between the two other duration categories. Within the filter, which is working as a legend again, all patterns are assigned to the three mentioned categories of “duration”.

4.2.2 Interactive Reading: Scroll, Hover, Select, Filter

The interaction techniques of the Narrelations interface are designed to support close reading and high-level analysis of stories (DG3) as well as the focused examination of narration elements and narratological categories (DG4).
Figure 12. 
Filtering speakers, type and mode of level transgressions enables a focus on specific annotations. Hovering over an embedded narration displays detailed information. Clicking on an embedded narration either in the text (left) or in the visualization (center) locks this segment.
Hovering over narration elements in the visualization opens a small pop-up window with detailed information about the embedded narration: speaker, type and mode of transgression (see Fig. 12). In addition, the text area scrolls to the corresponding text passage, which is marked by an underlining matching the color of the respective speaker. This coupling between visualization and text also works in reverse. With these interactions and visual supports we want to facilitate the coupling of visual analysis and text reading.
There are also two possibilities to select and lock an embedded narration. Either by clicking on a narration element in the visualization or by clicking on a text passage in the text area. The text of the selected passage is subsequently highlighted with a bold underline and marked with a black border in the visualization. An additional click selection of the locked passage/element, releases the lock again. For the purpose of comparative analysis of several embedded narrations, it is possible to lock multiple text passages and elements, which can be released at once by clicking on the reset button in the lower left corner of the interface.
By selecting the respective filter, one can focus on embedded narrations by a specific speaker (see Fig. 12). In order to keep a clear interface, all the passages and elements that do not pertain to the respective speaker are displayed in a bright shade of gray. Filter selections also allow for the focused consideration of embedded narrations with a certain type and mode of level transgression. There are eight possible combinations for types and modes of boundary crossings (see Fig. 2), which can be selected as filters. The embedded narrations that do not have the selected type and mode of transgression are displayed in a bright shade of gray, both in the text area and the visualization.
The third general function of the filter is the addition of the temporal aspects of narrative representation “order”, “frequency (repetitive)”, and “duration”. Only one of the three temporal phenomena can be selected at a time. Within “order” and “duration”, additional selections can be made (see Fig. 9 and 11). When selecting one of the phenomena only the embedded narrations, in which the selected category occurs, retain their opacity and color to ensure the focus and support a quick identification of which passages and elements are relevant for the narratological analysis.

4.3 Findings of Usability Test

While the reactions of all participants of the usability test were favorable, with several of them expressing interest in using such a tool for their research, the test helped identify several interaction issues.
Four out of the six participants found it difficult to compare two different embedded narrations in the text view: Once a text passage is locked the text does not automatically scroll to the second text passage when hovering over the corresponding embedded narration in the visualization. This fact often led to confusion and distracted the participants since it is subsequently necessary to manually scroll to reach the second text passage or unlock both embedded narrations first in order to hover over the second embedded narration again.
Several confusions related to the consistency of selection interactions. For example, most participants were confused about selecting and locking certain annotations of the temporal phenomena by clicking on them as is the case with the embedded narrations. Four out of six test persons tried to click on the elements representing the analepses/prolepses and repetitvely narrated events, which in the current version of the interface do not provide an additional interactive capability.
Furthermore there were issues with the interaction concerning the repetitively narrated events in the visualization and text view: By hovering over a bubble representing a repetitively narrated event, the viewer can only see one report in the text area. No participant understood how to display the other instances of this event in the text view; multiple click selections would not cycle through the corresponding text passages. In addition, they clicked on the dark gray mark within an embedded narration representing one report of a repetitively narrated event in order to get to this instance in the text, however, this interaction has not been implemented yet.
When the participants had the task to search for a particular text passage they missed an integrated search function within the text area, which allows them to look for specific words, sentences etc. (despite the fact that the browser’s built-in search function can be used for this purpose).

5. Merits for Literary Analysis and Interpretation

As observed during the usability test, the participants are free to choose their own preferred workflow when interacting with the text. The most common path of using the visualization for literary exploration and interpretation will probably start with the more abstract visual analysis provided by the general overview, then proceed to identifying interesting phenomena/correlations (“what stands out?”), and finally switch to a more detailed investigation of passages in the text view. This procedure can be iterated to the scholar’s liking. In the following, we will illustrate this path in more detail in two steps. After some explorative observations on the narratological features of eight German novellas, we will pursue the advanced interpretation of three of them in a close reading and contextualization.
Our selected narratives are eight German short stories which were written and published in the 19th century. Most of the eight short stories can be classified as German novella, which is a written fictional text of “indeterminate length” [Aust 2012, 11] in prosaic form. The content structure of the German novella is often “restricted to a single event, situation or conflict, which produces an element of suspense and leads to an unexpected turning point (Wendepunkt) so that the conclusion surprises even while it is a logical outcome” [Cudden 2013, 480]. More precisely, the German novella is often devoted to topics which are in conflict with social conventions [Klein 1965, 686].
A specific narrow thematic focus often corresponds with the idea of a concise cutout of an individual life [Klein 1965, 688]. In relation to its sensational topics, however, the theoretical discourse of the German novella reflects different form issues [Heyse and Kurz 2016]. One question in the theoretical discourse of the novella is to which degree the topic addressed by the novella relates to a narratological composition [Lubkoll 2008], [Gülich 1976]. Especially, in comparison to other literary genres, issues of narrative representation and temporality are more foregrounded in the novella, which seems to be a consequence of its relative brevity coupled with the integration of an unexpected turning point [Aust 2012, 16].
Regarding the scientific discourse on the German novella, the characterization of the novella “has always been very dissatisfying according to traditional genre”  [Lubkoll 2008, 381]. As Lubkoll points out, “typical formal and structural features are often too unspecific and mostly remain on the surface, if their function for the (con)text is not reflected adequately”  [Lubkoll 2008, 381].

5.1 Explorative Observations

Figure 13. 
Juxtaposing narrative visualizations of eight novellas: a) Ludwig Tieck: Der Pokal (1811), b) Friedrich Hebbel: Matteo (1841), c) Theodor Storm: Veronika (1861), d) Bertold Auerbach: Die Kriegspfeife (1863), e) Johannes Proelß: Lili (1883), f) Thomas Mann: Der Tod (1897), g) Maria Janitschek: Poverino (1897), and h) Frank Wedekind: Die Schutzimpfung (1903).
When considering the visualizations of all eight narratives side by side, it is easy to make first observations on how the texts differ from one another with regard to their narrative structure in correlation with temporal phenomena (see Fig. 13):
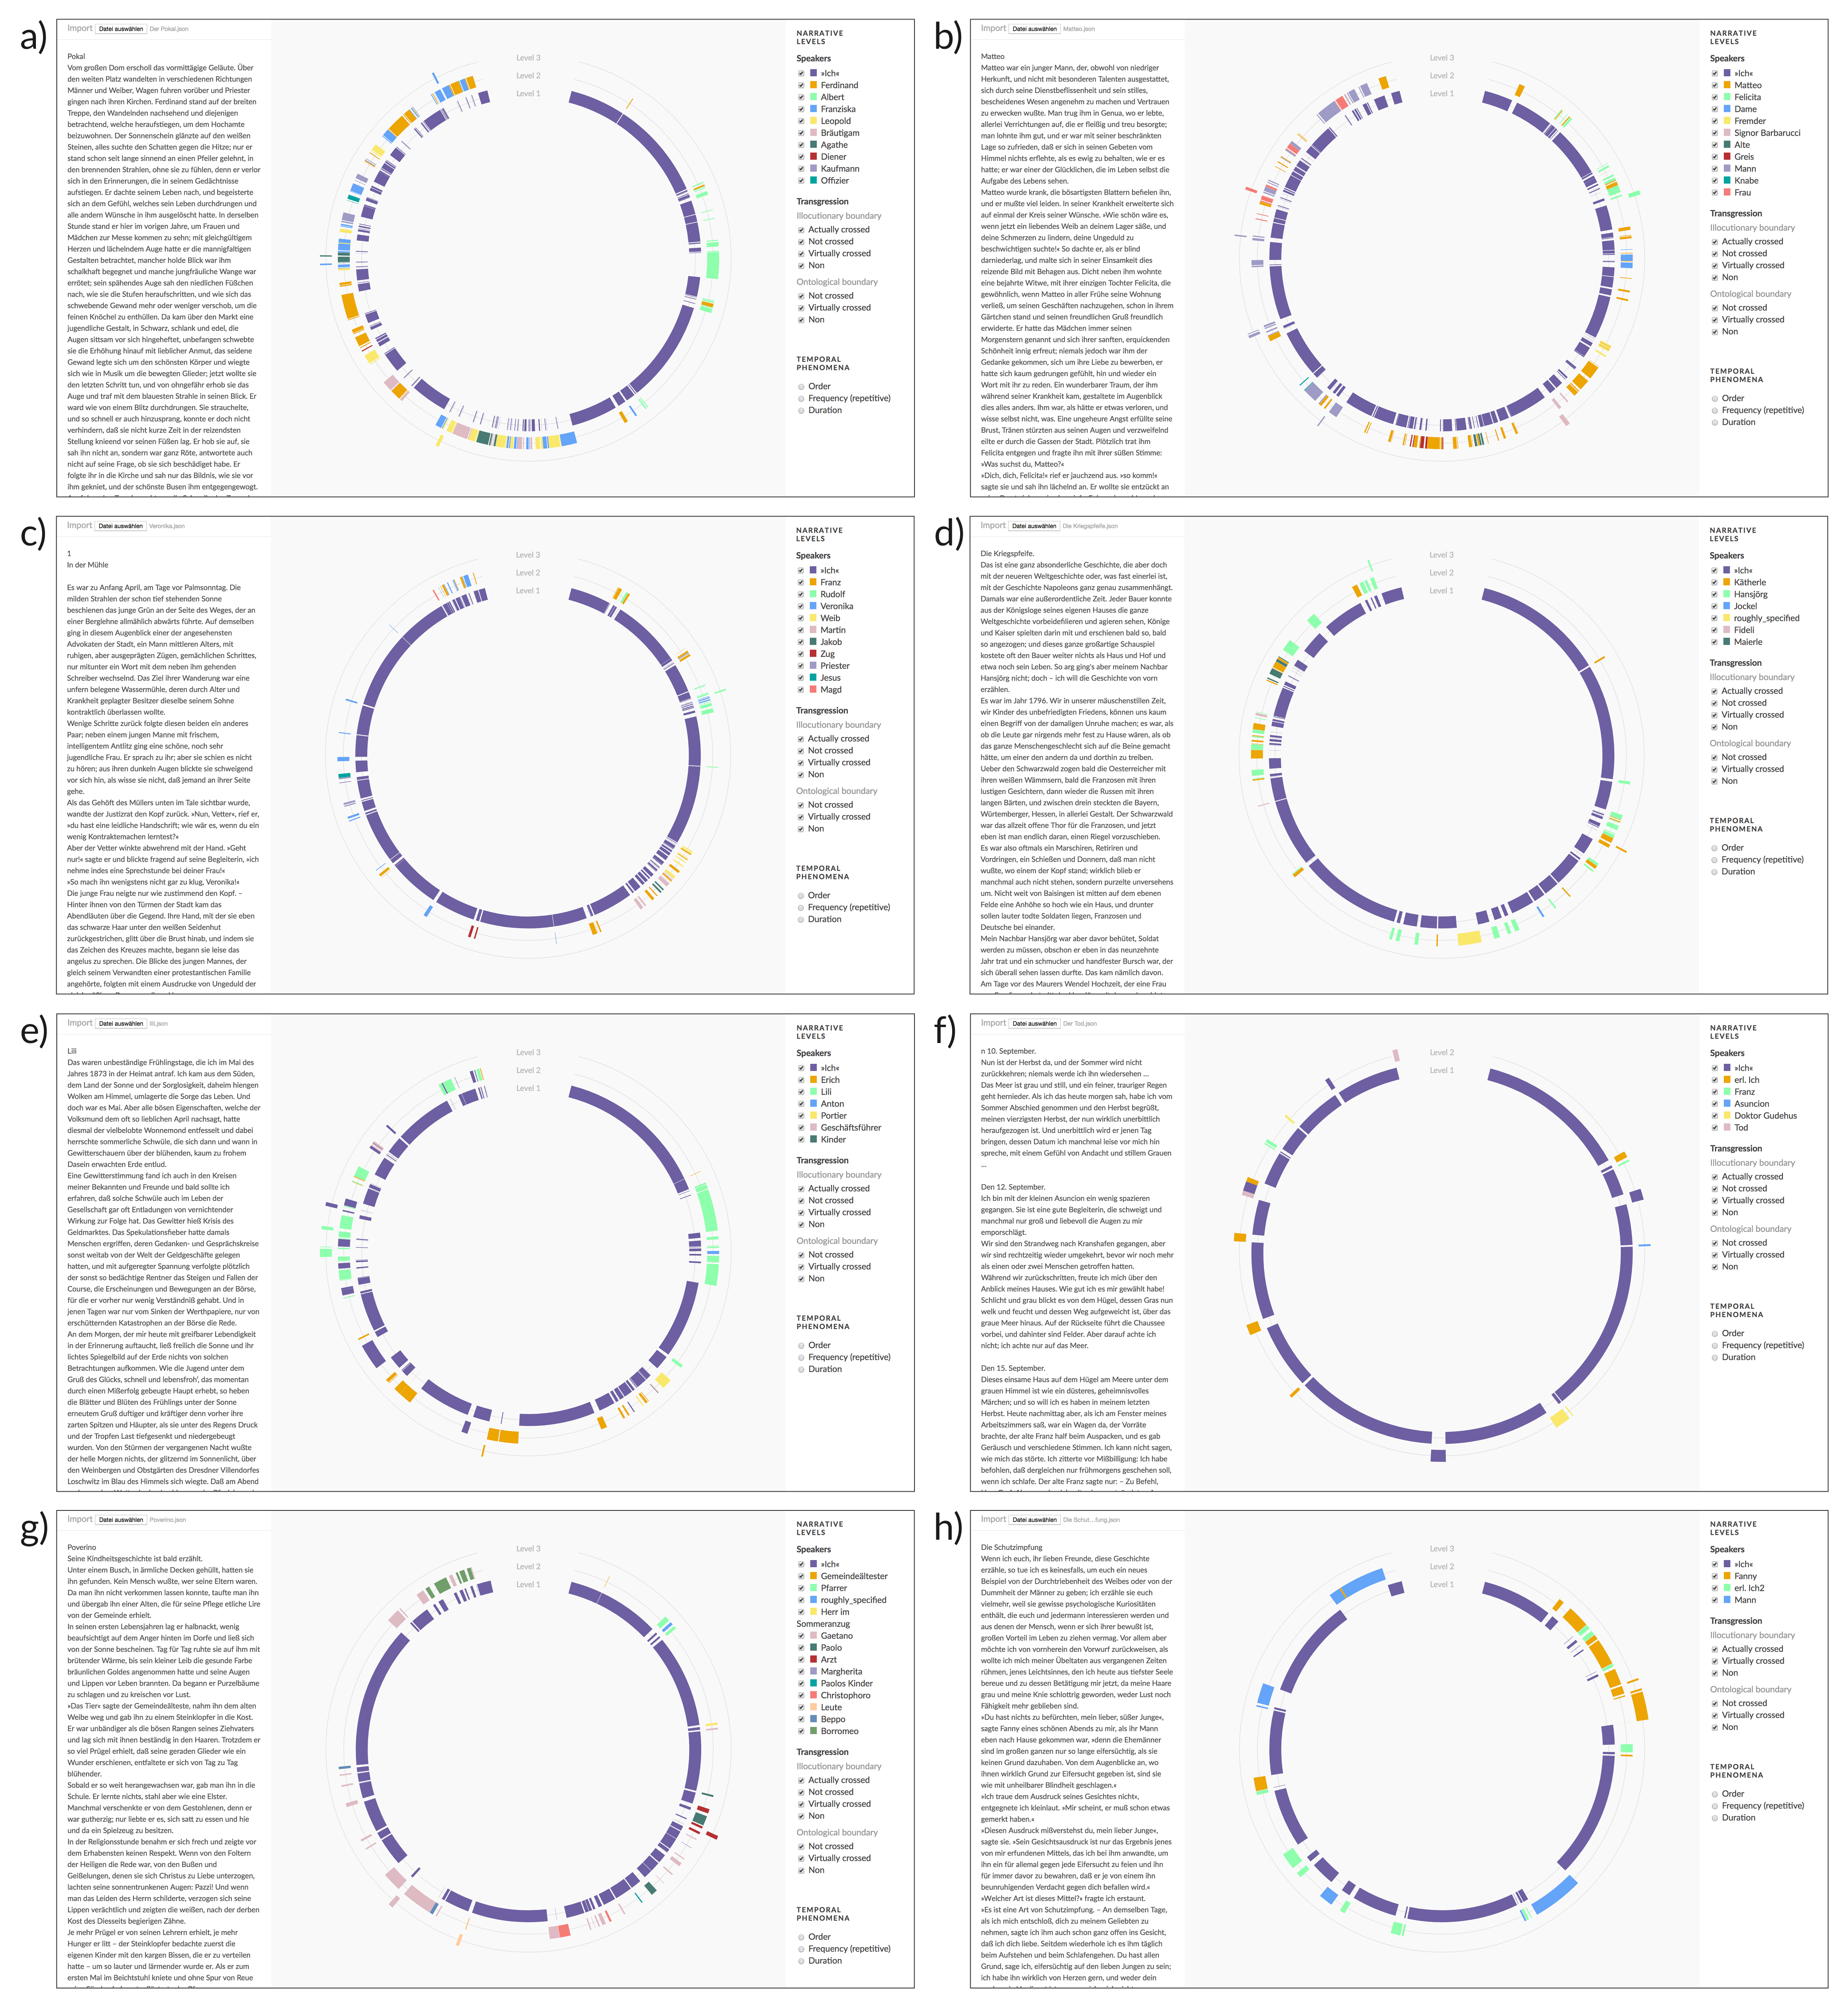
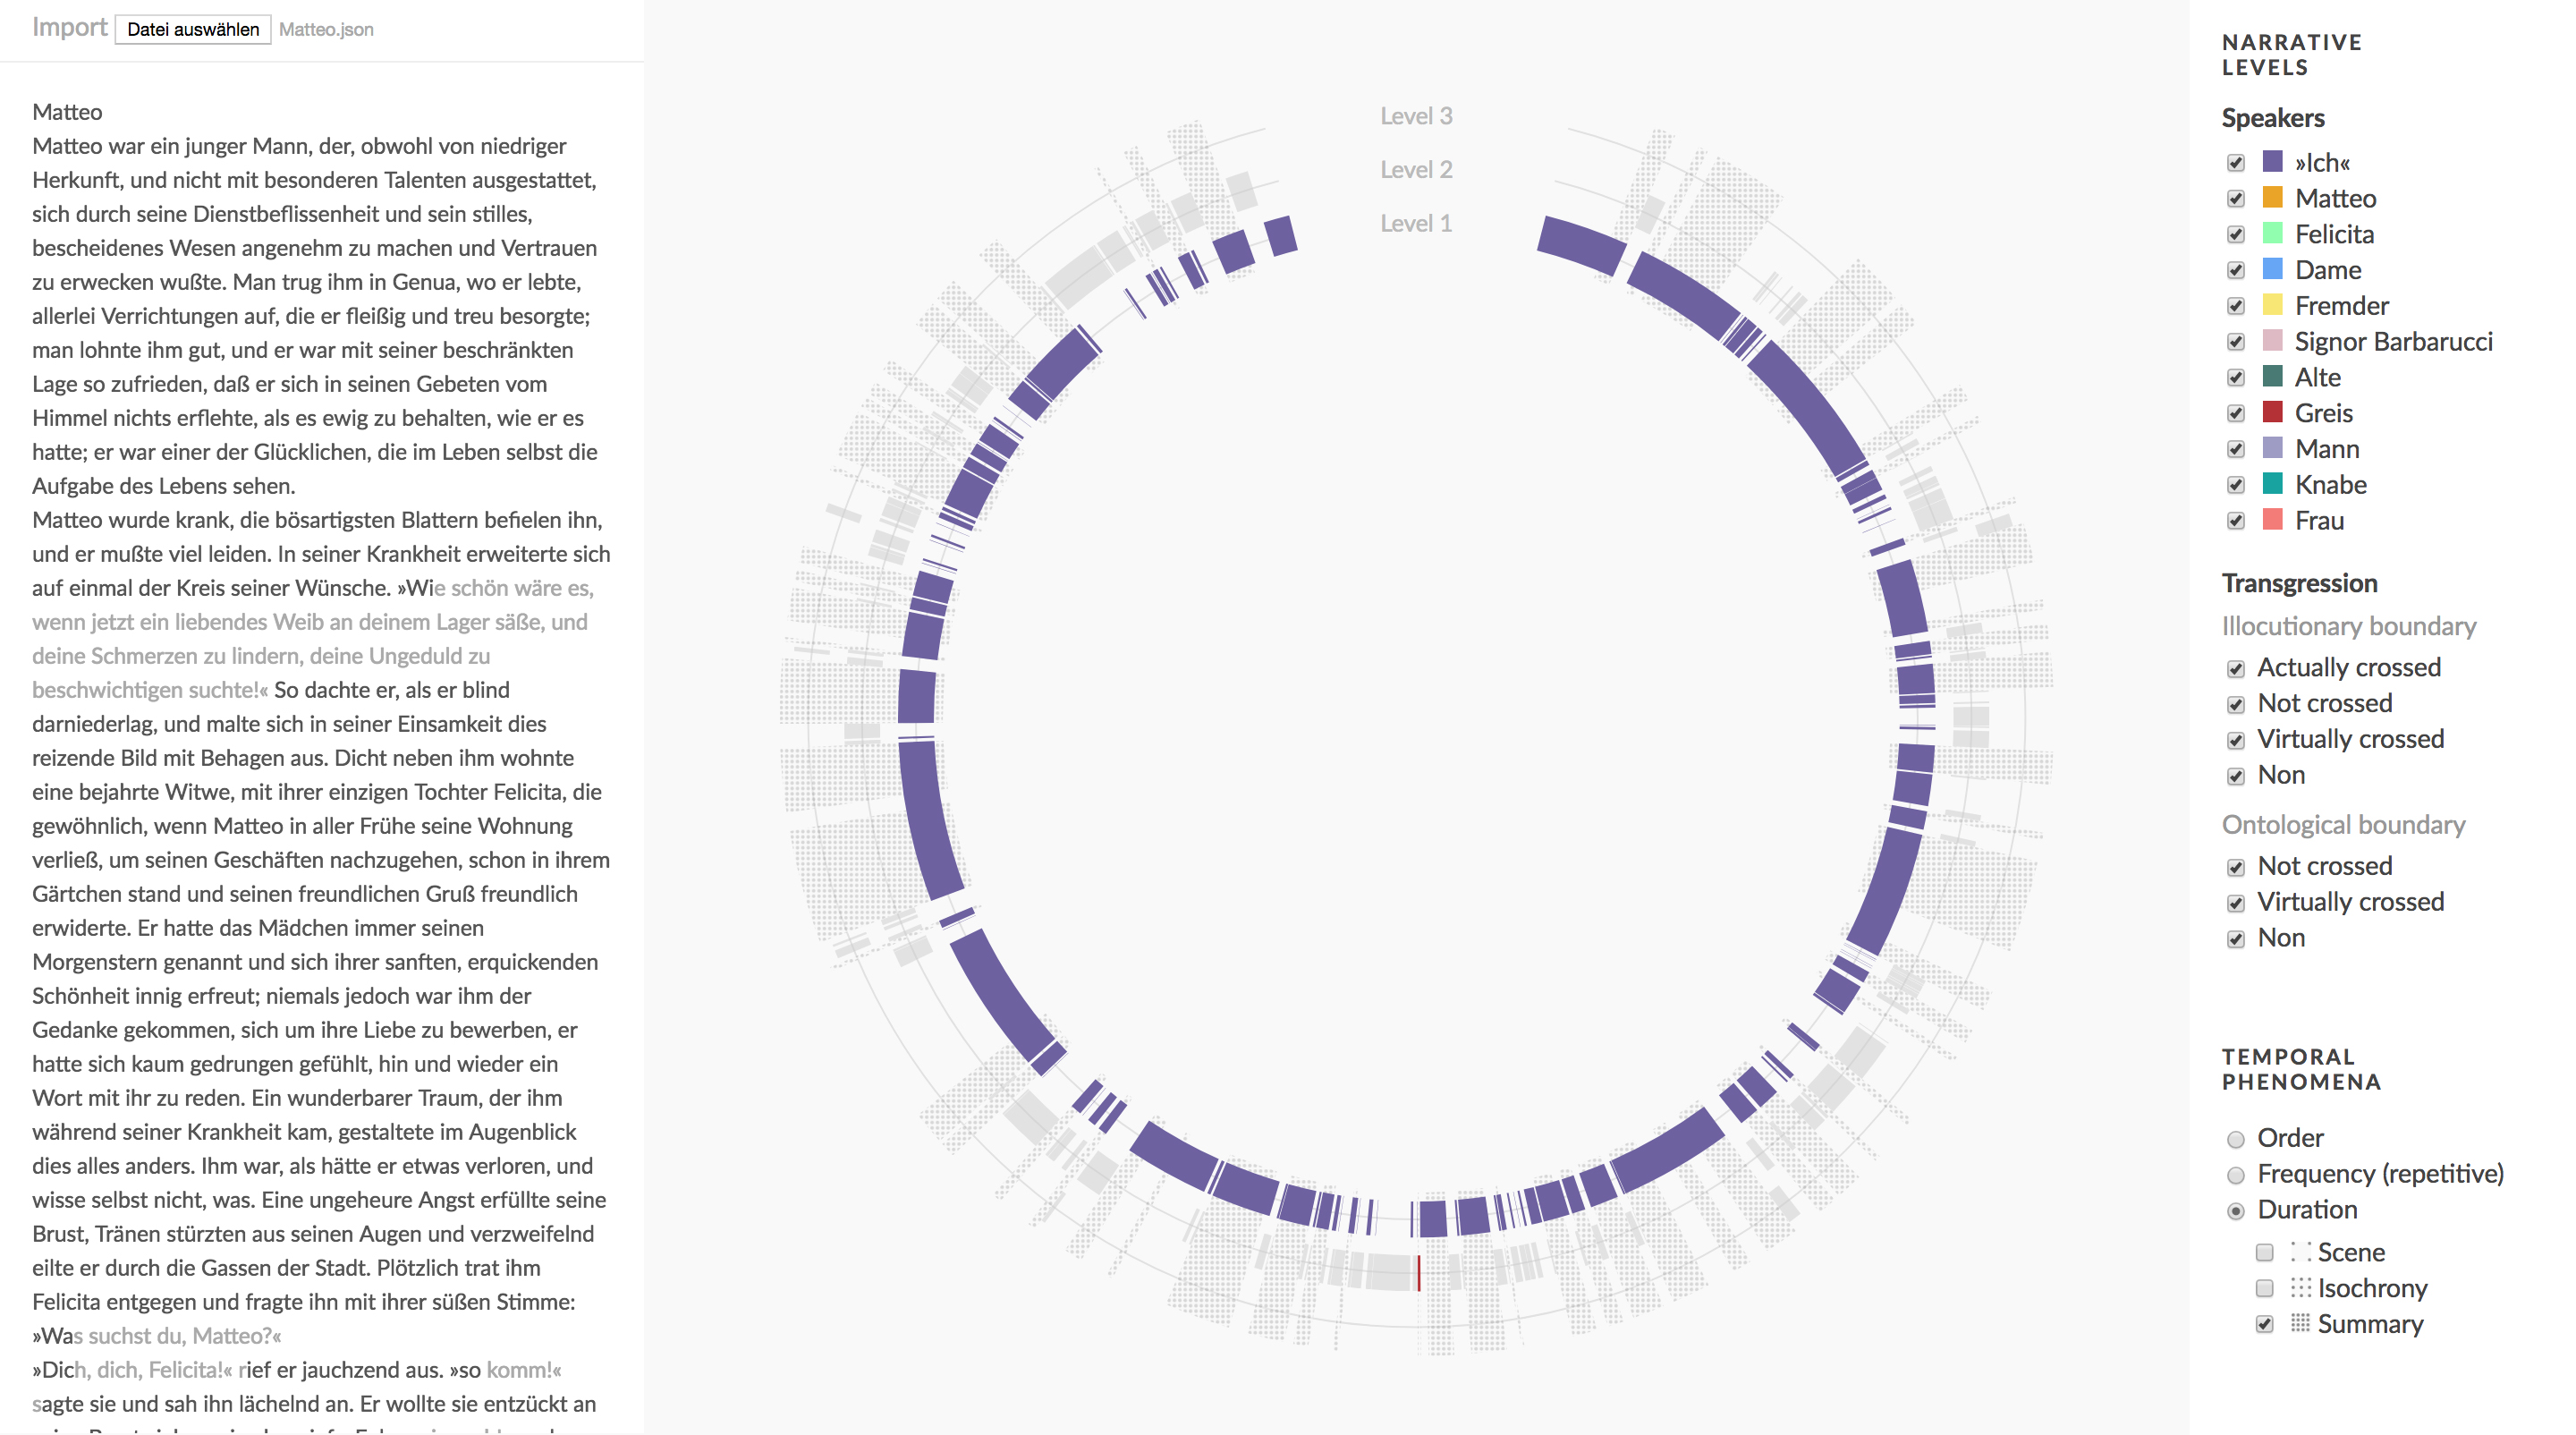
  • We can see that some texts show a rather regular distribution (e.g., b) Matteo with many embedded narrations throughout, f) Der Tod and h) Die Schutzimpfung with fewer), while others show irregular patterns (e.g., a) Der Pokal shows comparatively few embedded narrations in the first half of the narrative and many in the second half).
  • When it comes to the length of the embedded narrations, some stories (like b) Matteo) contain hardly any longer chunks of embedded levels, some contain the occasional larger chunk (e.g., a) Der Pokal and d) Die Kriegspfeife, e) Lili, and g) Poverino), while others (e.g., h) Die Schutzimpfung) mostly contain medium to large chunks of embedded levels.
  • If we have a look at the degree of embedding, we can see that only f) Der Tod does not contain any embedded narrations on a tertiary level. And the number of the narrators in a text ranges from very few (e.g., h) Die Schutzimpfung and f) Der Tod) to rather many (g) Poverino) – where Der Tod shows the additional peculiarity that a large proportion of the (longer) embedded level chunks are narrated by a narrator on the primary level.
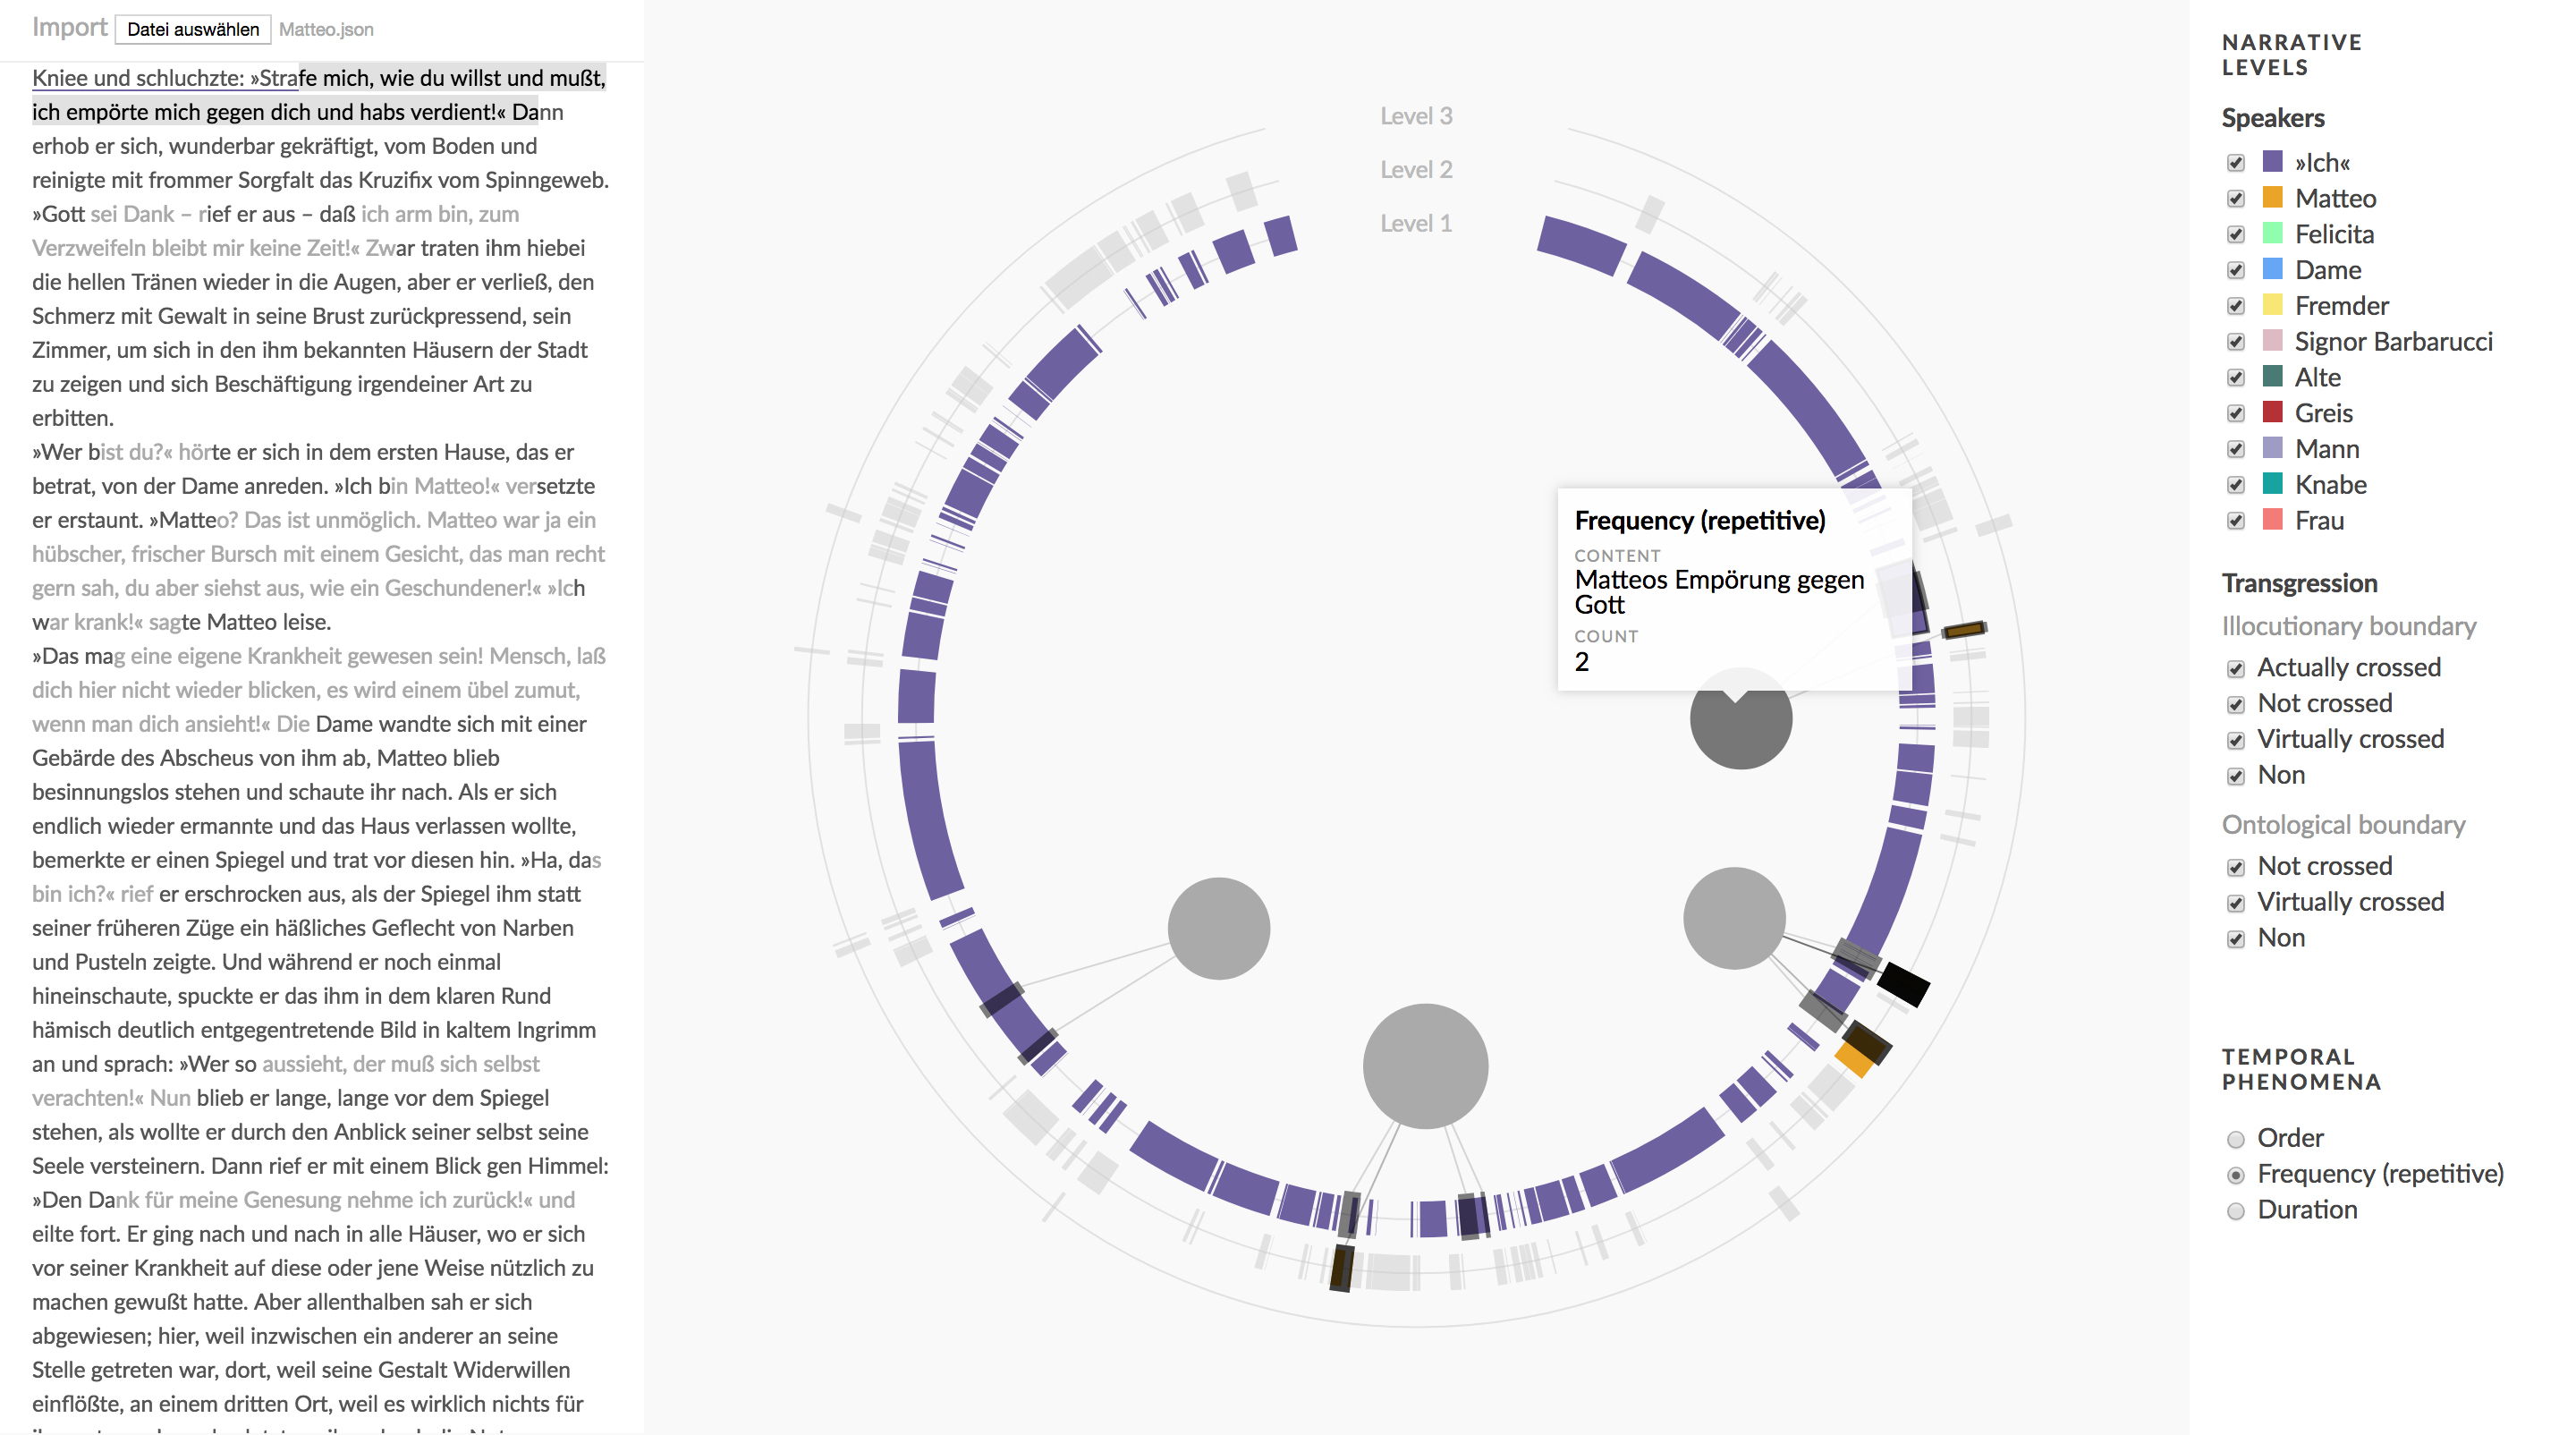
  • Concerning the types and modes of the boundaries crossed in the embedded narrations, we can see that two of the texts (h) Die Schutzimpfung and c) Veronika) only show one ontological crossing, while others show comparatively many (especially f) Der Tod, considering that there are few embedded narrations in total). What also sticks out is that every tertiary narration in b) Matteo is an ontological crossing.
Figure 14. 
Visualizing temporal order of four selected novellas: a) Frank Wedekind: Die Schutzimpfung (1903), b) Thomas Mann: Der Tod (1897), and c) Ludwig Tieck: Der Pokal (1811), d) Friedrich Hebbel: Matteo (1841).
If we switch on the display of temporal phenomena, we can also make some interesting observations in the inner ring of the circle visualization (see Fig. 14): Concerning temporal order, basically the whole narration in a) Die Schutzimpfung is an analepsis carried out by the primary narrator (the same goes for Die Kriegspfeife) – and the analepsis is only occasionally interrupted. All embedded narrations occur within the scope of the analepsis. Both a) Die Schutzimpfung and b) Der Tod also show comparably many prolepses – while c) Der Pokal is particularly noteworthy having one longer analepsis in the beginning, but many short ones in the second half correlating with embedded narrations. Other texts, especially d) Matteo, only contain comparably few and short analepses.
Figure 15. 
The frequency of event narrations is represented by the size of bubbles in the inner circle, with only one event in a) Frank Wedekind: Die Schutzimpfung (1903), many events with multiple instances in b) Ludwig Tieck: Der Pokal (1811) and four events in c) Friedrich Hebbel: Matteo (1841).
When it comes to frequency, two extremes can be observed (see Fig. 15): On the one hand, we have a) Die Schutzimpfung with only one repetitively narrated event (narrated twice be different embedded narrators); on the other hand, there is b) Der Pokal with 14 repetitively narrated events (some of them four times), with most of them occurring in the last two thirds of the narrative, which is indicated by the positioning of the bubbles towards the left and lower side of the circle. Another text that shows a noteworthy distribution of frequency phenomena is c) Matteo: Here, we have four events that are narrated twice, and each repetition occurs very shortly after the initial reporting of the events.
Figure 16. 
The duration of event narrations is visualized as textures with different granularities: a) Frank Wedekind: Die Schutzimpfung (1903), b) Ludwig Tieck: Der Pokal (1811) and c) Friedrich Hebbel: Matteo (1841).
As for duration, we can observe in Fig. 16 that a) Die Schutzimpfung (like Die Kriegspfeife) starts and ends with isochronous passages on the primary level, while in b) Der Pokal, a stretching of time shortly after the beginning stands out. In c) Matteo, there are relatively many medium to large summary chunks throughout the whole text, interrupted every now and then by passages of isochronic and scenic narration of the same length.

5.2 Interpretation via Close Reading and Contextualization

After having provided a selected description of the patterns visible in the Narrelations interface, the next step is now to investigate whether and, if so, in which way these observations can be related to other formal, content-related, or contextual features of the narratives. While some of the observations point out methodological choices that were made during the annotation process,[5] we would like to demonstrate the heuristic value of the visualization by providing three exemplary text analyses and interpretations of narrative structures of varying complexity – the selected novellas are Die Schutzimpfung, Der Tod, and Matteo.

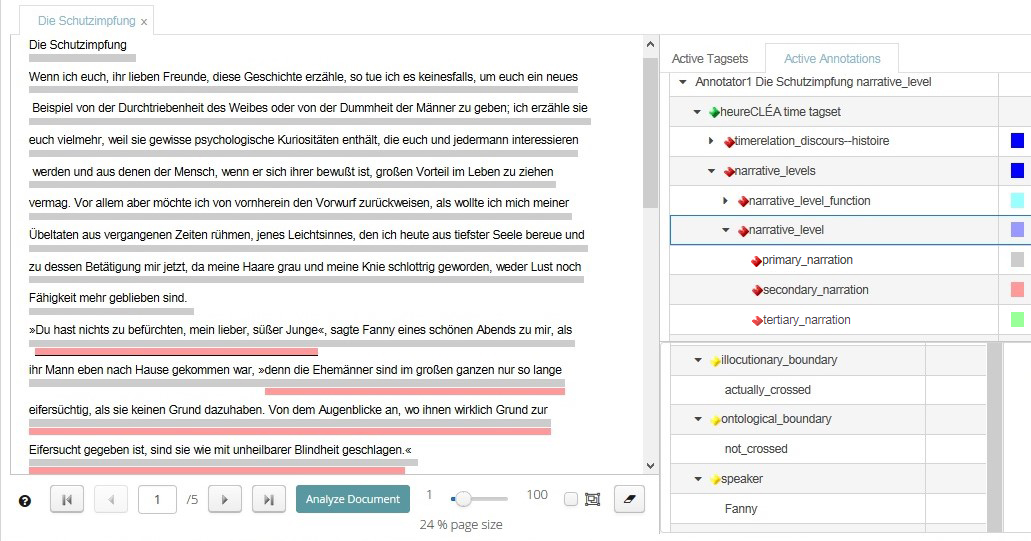
5.2.1 Die Schutzimpfung

The novella Die Schutzimpfung by Frank Wedekind is about a “vaccination” as a psychological trick a wife employs to prevent her husband from suspecting her infidelity. As we already gain from the overview of Die Schutzimpfung (see Fig. 13, h), the visualization illustrates the structural principle of “frame narration”, which is a common genre characteristic of the German novella that functions as a bracket around the “actual” story conveyed in a text. While the border between frame and inner narration can generally be constituted by a persistent boundary crossing, this is not the case for Die Schutzimpfung. As the visualization (coupled with a close reading of the relevant “switching passages”) shows, it is actually a large – and only occasionally interrupted – analepsis that marks the relevant border between frame and inner narration (see Fig. 14, a). This means that the primary (or frame) narrator of Die Schutzimpfung is also the one narrating the inner, “actual” story in retrospect. The function of the frame narration in Die Schutzimpfung is to make the narrator’s act of telling explicit [Lubkoll 2008, 390]. The frame narration of Die Schutzimpfung can be characterized as a conversational frame, in which the narrator introduces the audience to the newsworthy “tellability”  [Borani 2011] of a certain psychological oddity, the “vaccination”.[6] Raising the interest of the audience involves in Die Schutzimpfung a didactic and moral intent, which seems to cover the sexual sensational content of the story.
In the context of the frame and inner narration structure of Die Schutzimpfung, both these interruptions as well as the passages before and after the large inner narration can be classified as instances of metanarration [Neumann and Nünning 2014].[7] Especially significant are the first two longer chunks of interruptions in Die Schutzimpfung. These metanarrative comments appear before and after insinuating content is narrated, e.g., the nudity of a woman. The narrator claims that the insinuating content is not narrated to amuse the audience, but rather to provide proof for the surprising ways of human behavior.
In addition to this, the visualization shows that the metanarrative comments tend to correlate with stretchings of time. In this particular context a dash “–”, which suggests a pause before narrating the sensational content, is used: “– Sie entledigt sich auch der letzten Hülle und gesellt sich zu mir.” (“She gets rid of her last piece of clothing and joins me”). Regarding the duration phenomena for the whole narration, Die Schutzimpfung seems to play with the tension between hastening and slowness, which can, on the one hand, be regarded as analogy to the sexual tension between the two lovers. On the other hand, it has an impact on the affective and attentive dimension of the text between the narrator and the audience. The hesitation of narrating in correlation with the change of duration also creates an ironic tone. Moreover, with respect to the frequency phenomena (see Fig. 15), it seems that the visualization reveals the unexpected ironic turning point of the novella. The “event without precedent”, i.e., the wife openly telling her husband that she is in love with another man, is narrated twice – by an embedded narrator (the wife) in the first part of the text, and by a second embedded narrator (her husband) in the last part of the text.
As this short interpretative approach demonstrates, the visualization – coupled with close reading – both points out some significant correlations between the narrative levels and temporal phenomena, and elicits a critical reflection on a genre specific issue, i.e., the covering of the sensational content with a specific narrative and temporal structure.

5.2.2 Der Tod

The visual exploration of Thomas Mann’s Der Tod (1897) invites an interpretation of both form and content that pays particular attention to the interdependencies between the concepts for temporal analysis and narrative levels. As we can see at a glance in Fig. 13 (f), this novella appears with only two narrative levels and only a few embedded narrations as outliers. Der Tod consists of 14 journal entries made by a count, who believes his own death will occur on his 40th birthday, October 12th. The journal’s entries revolve around the anticipation of that day.
The dominant primary narrative level appears to correspond to the stream of consciousness or interior monologue of the count facing death. The flow of inner experiences and feelings passing through the mind of the count is evidenced by the dominant length of the primary level. Concerning the embedded narrations, it is important to mention that several of them are narrated by the experiencing I of the primary narrator. The simultaneous presence of the experiencing I in an embedded narration and the primary narrator at the primary level reinforces the stream of consciousness of the dying count and the egocentric focus of his multi-level narration.
Regarding the boundaries, it is also noteworthy that Der Tod shows many ontological boundaries with virtual crossings (7 out of 17 embedded narrations). Taking a close look at the respective text segments, it is apparent that the ontological boundaries consist of the narrator’s anticipations of death. Although the count is still alive and seems to be impatiently waiting for his own death, the ontological transgressions suggest the yet counterfactual status of death within the story. However, the fact that some of the narrator’s anticipations have been interpreted as prolepses (i.e., anticipations of actual events in the story) by the annotators undermines this impression and reveals an interesting ambiguity concerning temporality and transience in Der Tod.
As becomes clear, the visualization enables us to gain a deeper understanding of how Der Tod plays with the element of decay of life by employing a specific narrative structure. Further research could address the more general question of how death and mortality are represented in the German novella with regard to narrative and temporal structure.

5.2.3 Matteo

With the third exemplary analysis of Friedrich Hebbel’s Matteo (1839), we would like to explore more multilayered correlations between narrative structure and temporality. The novella tells the story of a young man of virtue, Matteo. After a disease, which deformed his handsome appearance, Matteo has to deal with female rejection and social humiliation. Hebbel’s novella reflects on the challenge of virtuousness in an unjust and ruleless society, where fate and inconsistency disempower human behaviour.
Matteo shows many embedded narrations of short length throughout the whole narration (see Fig. 13, b). Concerning the content structure, it appears that the distribution and short length of the embedded narrations correlate with Matteo’s life, which is falling apart. The cascade of injustice bestowed upon Matteo leads him to see the world as “unsinniges Kaleidoskop” (“unreasonable kaleidoscope”) without rules or purpose. The idea of life without reasonable meaning seems to manifest itself in the fragmented structure of the novella’s narrative levels.
A closer investigation of the embedded narrations reveals the role of ontological boundary crossings, which mostly occur on the tertiary level throughout the narrative. In contrast, the first ontological crossing is located on the secondary level and consists of a positive, hopeful dream Matteo has. This dream, however, is soon crushed – and from this moment on, all the remaining ontological crossings (mostly hypothetical anticipations of future events) turn out to be negative and calamitous, thus corresponding to Matteo’s deteriorating fate.
If we take a closer look at the frequency phenomena in Matteo, we can further see that the repeated narration of events does neither concern single “events without precedent” linked to a human conflict, nor does it serve as bracketing or connecting element in the narrative as it does in Die Schutzimpfung or Der Pokal (see Fig. 15). Instead, the frequency phenomena are much more isolated and tied to individual text passages, for instance, when Matteo expresses resentment against God.
Figure 17. 
Visualization shows the frequency phenomena in Matteo.
Unlikely for the literary genre of novellas, this analysis indicates that the whole narration is not based on one interpersonal conflict weaving a strong net through the story (as it does, for example, in Lili, Veronika, Der Pokal). Instead, Matteo is an example of a more episodic variant of the novella (see Fig. 17).
Another noteworthy aspect relating form and content in Matteo is revealed when we closely inspect the organization of temporal order in the narrative. It is striking that there are only a few short analepses in Matteo. Now, if we conceive of time as a continuum in which the presence is influenced by the past, analepses can be used to reflect on or to find explanations for why certain events happened. Considering the aforementioned issue of inconsistency in Matteo, one could argue that the specific makeup of order phenomena reinforces Matteo’s view of the world as an “unreasonable kaleidoscope” without rules and purpose that makes moments of reflection obsolete.
Figure 18. 
Visualization shows the duration phenomenon ‘summary’ in Matteo.
The hurried nature of the narrative becomes also visible in the visualization of duration phenomena emphasizing yet again the “pointlessness of being” in Matteo. As shown in Fig. 18, a great amount of text passages is classified as summaries. The predominance of summaries, filling in the spaces between individual episodes in Matteo’s life that are narrated in slower pace, gives the impression of a hastening from one negative experience to the next, and thus of an inescapable fate.
Summarizing the visually supported interpretation of Matteo, we can say that the Narrelations visualization not only points to the more episodic makeup of Matteo, which distinguishes the narrative from most of the other analyzed texts. Matteo is also a good example to show how a multitude of different structural features can be related to overarching thematic aspects of the text – a complex and laborious task that was significantly facilitated by the overview of the visualization and interactive filtering provided by the interface.

6. Conclusion

The visual exploration of three exemplary texts demonstrates the heuristic value of the visualization for narratological analyses and interpretations. While the visualization of Die Schutzimpfung serves to elicit critical insights in the discourse structure of the novella, the analysis of Der Tod shows the visualization as a “mediator”  [Hinrichs and Forlini 2017] by helping connect the fragmented narrative structure with the decaying life of the narrator. In the final analysis of Matteo, the visualization helps to understand the significant alliance between content-related and formal issues. With reference to Lubkoll, who claims the academic void that “the different catalogues of typical features mostly appear as static schemes that cannot do justice equally well to all the various manifestations of the ‘Novelle’ as to the historical change of the genre itself”  [Lubkoll 2008, 381], the Narrelations visualization enables a dynamic analysis of a single novella as well as critical and comparable insight into the genre of German novellas, for instance, the function of the turning point. It thus seems justified to assume that the visualization tends to serve as explorative and discursive function, rather than merely illustrative purposes that one attends to a posteriori one’s intellectual engagement with a work of literature.
In summary, we have made three main contributions: First, we provided an extensive reflection about the relevance of narratological analysis for literary interpretation, its complex and multilayered makeup, and the difficulty of exploring and evaluating the analysis data. Second, we have presented an interactive visualization technique for narratological analysis of literary works and described the collaborative design process resulting in a specific visual encoding that reveals the nesting and distribution of narrative levels, integrates the representation of temporal phenomena, and facilitates the examination of correlations between these aspects. Third, we utilized the Narrelations interface to explore the relationship between literary content of eight German novellas and their respective narrative structures, and thus demonstrated the heuristic value of visualization for literary analysis and interpretation.
This being said, it also seems fair to point out the limitations of the visualization. First of all – and this goes for all kinds of heuristic devices – the Narrelations visualization, of course, shows a large number of phenomena and correlations, not all of which are necessarily interesting or relevant. It is always the scholar’s task to appraise the many observations and decide which are meaningful and which are merely coincidental. The possibility to iteratively shift between overview and close reading certainly helps in making these decisions. Second, the visualization certainly does not substitute interpretation at the textual level. What visualization can support, however, is a detailed analysis of the structural makeup of a narrative – the challenge of making sense of it is left to the literary scholar to pursue. And finally, we still have to ask to which extent and in which ways does the visualization help generate new knowledge about narrative form. The observations that we were able to make about the narrative levels of the German novellas were in part guided by the visualization, however, the close reading of the stories constituted an essential part of the research process.

Acknowledgements

We would like to thank Christian Laesser for supporting us to refine the interface and interaction capabilities and for developing the first web-based prototype of Narrelations which provided the possibility to examine different short stories and test the visualizations potential. We thank Prof. Dr. Jan Christoph Meister and Prof. Dr. Evelyn Gius for their continuous feedback and suggestions for modification and improvements. We would like to thank the participants of the Usability Test, who enabled us to test the functionality and ease-of-use of the Narrelations interface.
Funding for this research was provided by University of Applied Sciences Potsdam, Universität Hamburg, and Hamburg’s Ministry for Science and Research (3DH Project).

Notes

[1] A special case of illocutionary boundary crossing happens when a narrator who retrospectively tells a story in which he or she features as a character quotes his or her “previous self”: the “narrated” or “experiencing I”.
[2] Ryan herself does not account for the whole extent of this complexity: In her listing of possible combinations, she fails to mention cases 2 and 4, without providing arguments for excluding these cases [Ryan 1991, 176–177].
[3] Details can be found in [Gius and Jacke 2016].
[4] Automated annotation functionalities for tense and temporal signals are already available in the current CATMA version (www.catma.de), the functionality to automatically identify order phenomena will be implemented in the course of 2019, and an automated annotation of frequency phenomena has been found to be feasible as well.
[5] Two examples should be mentioned in this context: (1) In the heureCLÉA project, a rather wide concept of embedded narrative levels via illocutionary crossing was applied: A new level occurs whenever a character in the story rises to speak. This choice explains why some visualizations (e.g., the one for Matteo, see Fig. 13) show so many “micro level chunks” with alternating narrators: they simply show passages of quoted dialogue. Embedded narrations (via illocutionary crossing) in the narrower sense are represented by larger level chunks. (2) As we can see, for example, for Die Schutzimpfung, passages of quoted speech (actual crossings of illocutionary boundaries in embedded levels) always correlate with isochronous narration. This is due to the fact that in heureCLÉA, duration was only annotated on the primary narrative level. The duration annotations and their visualizations thus only show how characters’ speech acts are narrated – but we cannot make any observations concerning the duration of what is told by the characters in the embedded levels.
[6] The narrator in Die Kriegspfeife, which is also structured in terms of frame and inner narration, equally points out the outrageousness of the narrated event, e.g. “eine ganz absonderliche Geschichte”.
[7] “Metanarration and metafiction are umbrella terms designating self-reflexive utterances, i.e. comments referring to the discourse rather than to the story”  [Neumann and Nünning 2014, ¶1].

Works Cited

Alexander 2014 Alexander, E., Kohlmann, J., Valenza, R., Witmore, M., and Gleicher, M., 2014. “Serendip: Topic Model-Driven Visual Exploration of Text Corpora.” VAST 2014: IEEE Symposium on Visual Analytics Science and Technology, 173–182.
Auerbach 1893 Auerbach, B., 1893. “Die Kriegspfeife.” Auerbach, B. Gesammelte Schriften, 2. Gesamtausgabe, Vol. 1. Stuttgart: Cotta.
Aust 2012 Aust, Hugo, 2012. Novelle. 5th Edition. Stuttgart: Metzler
Borani 2011 Borani, R., 2011. “Tellability.” The Living Handbook of Narratology: http://www.lhn.uni-hamburg.de/article/tellability (last access: 07.05.2018).
Bradley 2012 Bradley, A. J., 2012. “Violence and The Digital Humanities Text as Pharmakon.” Proceedings of the Digital Humanities, 3.
Bögel et al. 2015 Bögel, T, Gertz, M., Gius, E., Jacke, J., Meister, J. C., Petris, M., and Strötgen, J., 2015. “Collaborative Text Annotation Meets Machine Learning. heureCLÉA, a Digital Heuristic of Narrative.” DHCommons Journal 1: https://dhcommons.org/journal/issue-1/collaborative-text-annotation-meets-machine-learning-heurecl%C3%A9-digital-heuristic (last access: 22.04.2018).
Chaturvedi et al. 2012 Chaturvedi, M., Gannod, G., Mandell, L., Armstrong, H., and Hodgson, E., 2012. “Myopia: A Visualization Tool in Support of Close Reading.” Digital Humanities, 2.
Collins et al. 2009 Collins, C., Viégas, F. B., and Wattenberg, M., 2009. “Parallel Tag Clouds to Explore and Analyze Faceted Text Corpora.” Visual Analytics Science and Technology (VAST) 2009: IEEE Symposium on Visual Analytics Science and Technology, 91–98.
Correll et al. 2011 Correll, M., Witmore, M., and Gleicher, M., 2011. “Exploring Collections of Tagged Text for Literary Scholarship.” Computer Graphics Forum, volume 30, 731–740. Wiley Online Library.
Cudden 2013 Cudden, J. A., 2013. A dictionary of literary terms and literary theory. 5th Edition. Oxford: Blackwell.
Dilthey 1900 Dilthey, W., 1900. “Die Entstehung der Hermeneutik.” Philosophische Abhandlungen. Festschrift für Christoph Sigwart. Tübingen.
Dou et al. 2012 Dou, W., Wang, X., Skau, D., Ribarsky, W., and Zhou, M. X., 2012. “Leadline: Interactive Visual Analysis of Text Data Through Event Identification and Exploration.” Visual Analytics Science and Technology (VAST) 2012: IEEE Symposium On Visual Analytics Science And Technology, 93–102.
Drucker 2014 Drucker, J., 2014. Graphesis: Visual Forms of Knowledge Production. Harvard University Press.
Dörk and Knight 2015 Dörk, M., and Knight, D., 2015. “WordWanderer: A Navigational Approach to Text Visualisation.” Corpora, 10(1), 83–94.
Fulda et al. 2016 Fulda, J., Brehmer, M., and Munzner, T., 2016. “Timelinecurator: Interactive Authoring of Visual Timelines from Unstructured Text.” IEEE Transactions on Visualization and Computer Graphics 22(1), 300–309.
Genette 1980 Genette, G., 1980. Narrative Discourse. An Essay in Method. Oxford: Blackwell.
Geng et al. 2015 Geng, Z., Cheesman, T., Laramee, R. S., Flanagan, K., and Thiel, S., 2015. “ShakerVis: Visual Analysis of Segment Variation of German Translations of Shakespeare’s Othello.” Information Visualization 14(4), 273–288.
Gius and Jacke (submitted) Gius, E., and Jacke, J. (submitted). “Order, Frequency, Duration – and Narrative Levels A Computational Narratology approach towards the development and application of literary concepts.”.
Gius and Jacke 2016 Gius, E., and Jacke, J. 2016. Zur Annotation narratologischer Kategorien der Zeit. Guidelines zur Nutzung des CATMA-Tagsets. Version 2, Hamburg: http://heureclea.de/guidelines/ (last access: 22.04.2018).
Gius and Jacke 2017 Gius, E., and Jacke, J., 2017. “The Hermeneutic Profit of Annotation. On Preventing and Fostering Disagreement in Literary Analysis.” International Journal for Humanities and Arts Computing 11(2), 233–254.
Gius et al. 2017 Gius, E., Jacke, J., Meister, J. C., and Petris, M., 2017. heureclea/time-annotations-uncompared-public. Version 1.1 [Data set]. Zenodo: https://zenodo.org/record/321438#.Wtzli38uDIU (last access: 22.04.2018).
Gülich 1976 Gülich, E., 1976. “Ansätze zu einer kommunikationsorientierten Erzähltextanalyse (am Beispiel mündlicher und schriftlicher Erzähltexte)”. Erzählforschung 1. Theorien, Modelle und Methoden der Narrativik. ed. Haubrichs, W. Göttingen: Ruprecht, 224–256.
Hebbel 1963 Hebbel, F., 1963. “Matteo”. Hebbel, F. Werke. ed. by Fricke, G., Keller, W., and Pörnbacher, K. München: Hanser. First published 1841.
Heyse and Kurz 2016 Heyse, P. and Kurz, H., 2016. “Einleitung”. Deutscher Novellenschatz. eds. Heyse P. and Kurz, H. München: R. Oldenbourg. First published 1871.
Heyworth 1998 Heyworth, G., 1998. “Novel and Romance: Etymologies.” Encyclopedia of the Novel. ed. Schellinger, P. Chicago. Fitzroy: https://literature-proquest-com.proxy.uchicago.edu/searchFulltext.do?id=R00792106&divLevel=0&queryId=3050765069411&trailId=1628D638E1B&area=ref&forward=critref_ft (last access: 03.05.2018).
Hinrichs and Forlini 2017 Hinrichs, U., and Forlini S., 2017. “In Defense of Sandcastles: Research Thinking through Visualization in DH.” Proceedings of Digital Humanities 2017
Hinrichs et al. 2016 Hinrichs, U., Forlini, S., and Moynihan, B., 2016. “Speculative Practices: Utilizing Infovis to Explore Untapped Literary Collections”. IEEE Transactions on Visualization and Computer Graphics 22(1), 429–438.
Hoyt et al. 2014 Hoyt, E., Ponto, K., and Roy, C., 2014. “Visualizing and Analyzing the Hollywood Screenplay with ScripThreads.” DHQ: Digital Humanities Quarterly 8(4).
Janitschek 1897 Janitschek, M., 1897. “Poverino.” Kreuzfahrer. Leipzig, Verlag Kreisende Ringe (Max Spohr).
Jänicke et al. 2015a Jänicke, S., Franzini, G., Cheema, M. F., and Scheuermann, G., 2015. “On Close and Distant Reading in Digital Humanities: A Survey and Future Challenges”. Eurographics Conference on Visualization (EuroVis) – STARs, 83–103.
Jänicke et al. 2015b Jänicke, S., Geßner, A., Franzini, G., Terras, M., Mahony, S., and Scheuermann, G., 2015. “TRAViz: A Visualization for Variant Graphs”. Digital Scholarship in the Humanities 30(suppl_1), i83–i99.
Kehoe and Gee 2013 Kehoe, A., and Gee, M., 2013. “eMargin: A Collaborative Textual Annotation Tool.” Ariadne 71.
Kim et al. 2018 Kim, N. W., Bach, B., Im, H., Schriber, S., Gross, M., and Pfister, H., 2018. “Visualizing Nonlinear Narratives with Story Curves”. IEEE Transactions on Visualization and Computer Graphics 24(1), 595–604.
Kindt and Müller 2003 Kindt, T., and Müller, H.-H., 2003. “Narrative Theory and/or/as Theory of Interpretation.” What Is Narratology? Questions and Answers Regarding the Status of a Theory. eds. Kindt, T., and Müller, H.H. Berlin: de Gruyter, 205–219.
Klein 1965 Klein, J., 1965. “Novelle.” Reallexikon der deutschen Literaturgeschichte. eds. Merker, P., and Stammler, W. Berlin: de Gruyter, 685–701.
Koch et al. 2014 Koch, S., John, M., Wörner, M., Müller, A., and Ertl, T., 2014. “VarifocalReader – In-Depth Visual Analysis of Large Text Documents.” IEEE Transactions on Visualization and Computer Graphics 20(12), 1723–1732.
Lewis 1982 Lewis, C., 1982. “Using The ‛Thinking-Aloud’ Method in Cognitive Interface Design”. Technical Report RC9265, IBM TJ Watson Research Center.
Liu et al. 2013 Liu, S., Wu, Y., Wei, E., Liu, M., and Liu, Y., 2013. “Storyflow: Tracking the Evolution of Stories”. IEEE Transactions on Visualization and Computer Graphics 19(12), 2436–2445.
Lubkoll 2008 Lubkoll, C., 2008. “Fingierte Mündlichkeit - inszenierte Interaktion. Die Novelle als Erzählmodell.” Zeitschrift für Germanistische Linguistik 36(3), 381–402.
Luhn 1960 Luhn, H. P., 1960. “Key Word-In-Context Index for Technical Literature (kwic index).” Journal of the Association for Information Science and Technology 11(4), 288–295.
Mann 2004 Mann, T., 2004. “Der Tod.” Große kommentierte Frankfurter Ausgabe. Werke – Briefe – Tagebücher, Vol. 2.1: Frühe Erzählungen. 1893–1912, ed. by Detering, H. and Reed, T. J. Frankfurt a. M.: S. Fischer. First published 1897.
McCurdy et al. 2016 McCurdy, N., Lein, J., Coles, K. and Meyer, M., 2016. “Poemage: Visualizing the Sonic Topology of a Poem.” IEEE Transactions on Visualization and Computer Graphics 22(1), 439–448.
Meister et al. 2016 Meister, J. C., Petris, M., Gius, E., and Jacke, J., 2016. CATMA 5.0 (2016) [softward for text annotation and analysis]: http://catma.de (last access: 14.05.2018).
Meister et al. 2017 Meister, J. C., Drucker, J. and Rockwell, G., 2017. “Modeling Interpretation in 3DH: New Dimensions of Visualization.” Proceedings of Digital Humanities 2017.
Munroe 2009 Munroe, R., 2009. xkcd: Movie Narrative Charts. http://xkcd.com/657/ (last access: 01.05.2018).
Muralidhara and Hearst 2013 Muralidharan, A. and Hearst, M. A., 2013. “Supporting Exploratory Text Analysis in Literature Study.” Literary and Linguistic Computing, 28(2). 283–295.
Neumann and Nünning 2014 Neumann, B. and Nünning, A., 2014. “Metanarration and Metafiction.” The Living Handbook Narratology. http://www.lhn.uni-hamburg.de/article/metanarration-and-metafiction (last access: 04.05.2018).
O'Toole 2018 O'Toole, M., 2018. The Hermeneutic Spiral and Interpretation in Literature and the Visual Arts. New York: Routledge.
Piez 2010 Piez, W., 2010. “Towards Hermenuetic Markup: An Architectural Outline.” Proceedings of Digital Humanities 2010. 202–205.
Proelß 1883 Proelß, J., 1883. Lili. In Proelß J. Katastrophen. Poetische Bilder aus unserer Zeit. Stuttgart: Adol Bonz and Comp.
Qiang et al. 2017 Qiang, L. Bingjie, C., and Haibo, Z., 2017. “Storytelling by the Storycake Visualization.” The Visual Computer 33(10), 1241–1252.
Ryan 1991 Ryan, M. L., 1991. Possible Worlds, Artificial Intelligence, and Narrative Theory. Bloomington: Indiana Universit Press.
Sanders and Stappers 2008 Sanders, E. and Stappers, P.J., 2008. “Co-creation and the New Landscapes of Design.” Co-design 4(1), 5–18.
Schleiermacher 1838 Schleiermacher, F., 1900. Hermeneutik und Kritik. Berlin: Reimer.
Shneiderman 2003 Shneiderman, B., 2003. “The Eyes Have It: A Task by Data Type Taxonomy for Information Visualizations.” The Craft of Information Visualization. ed. B. Bederson. Amsterdam: Kaufmann, 364–371.
Storm 1967 Storm, T., 1967. “Veronika”. Sämtliche Werke in vier Bänden. ed. P. Berlin Goldammer: Aufbau. First published 1861.
Tanashi and Ma 2012 Tanahashi, Y., & Ma, K. L., 2012. “Design considerations for optimizing storyline visualizations”. In IEEE Transactions on Visualization and Computer Graphics 18(12), 2679–2688.
Tieck 1963 Tieck, L., 1963. “Der Pokal”. Werke in Vier Bänden. ed. M. München Thalmann: Winkler. First published 1812.
Viégas and Wattenberg 2008 Viégas, F.B., and Wattenberg, M., 2008. “Tag Clouds and the Case for Vernacular Visualization”. Interactions 15(4), 49–52.
Vuillemot et al. 2009 Vuillemot, R., Clement, T. Plaisant, C. and Kumar, A., 2009. “What's being said near 'Martha'?”. Visual Analytics Science and Technology (VAST) 2009. IEEE Symposium on Visual Analytics Science and Technology, 107–114.
Walsh 2014 Walsh, B., Maiers, C., Nally, G., Boggs, J., and Praxis Program Team, 2014. “Crowdsourcing Individual Interpretations: Between Microtasking and Macrotasking”. Literary and Linguistic Computing, 29(3), 379–386.
Wattenberg and Viégas 2008 Wattenberg, M. and Viégas, F. B., 2008. “The word tree, an interactive visual concordance”. IEEE Transactions on Visualization and Computer Graphics 14(6), 1221–1228.
Wedekind 1969 Wedekind, F., 1969. Die Schultzimpfung. Werke in drei Bänden, Vol. 3: Prosa. Berlin, Weimar: Aufbau. First published 1903.
van Ham et al. 2009 van Ham, F., Wattenberg, M., and Viégas, F. B., 2009. “Mapping Text with Phrase Nets.” IEEE Transactions on Visualization and Computer Graphics 15(6), 1169–1176.
2019 13.3  |  XMLPDFPrint