Abstract
In this article, we discuss a way for visualizing interactions or solidarities in
a past community. The method that we expound is derived from process-oriented
views used in the industry. Therefore, this attempt to adopt practices from
outside of the traditional humanities framework must be clearly justified in
terms of epistemological position and in terms of choice among the numerous
available tools. First, we try to define what the process term could mean in the
humanities; then we explain our choice of a representation; we also carry out
tests of our method on selected case studies to visualize and question scholarly
works. Last, we offer the reader a prototype that must be improved to produce
automatic visualization of particular situations.
Introduction
Designing tools that help visualize scholarly works and offer various
perspectives is undoubtedly one of the key features of the Digital Humanities.
Indeed, as explained by members of the
Republic of
Letters program, visualizing helps see things “we did not see before” and “get a better sense
of the overall shape and structure”.
[1]In this work, we discuss a “method of representation”
[2] that provides both a
pedagogical assistance and a synthetic tool for such visualizations. Indeed, we
propose to explore a core aspect in human organizations, namely the way they set
up, consciously or not, a process to structure their practices. In order to
highlight and characterize certain practices among others as a process, we
develop a rigorous “representation” that we fully expand with
the help of the latest web standards. In addition, we connect this
representation to a model of data open to any results of the same type. The
conclusions that we present here come from encounters between scholars and
experts in the quality of industrial processes. From the discussions between
these counterparts, finding a common language ideally based on clear rules, in
order to ensure a thorough understanding of each other, has emerged as a
necessity. What follows is thus intended for pedagogical purposes, but it could
also be regarded as a help to put new questions to the foreground.
At first view there seems to be a tremendous distance between research on history
and the search for optimal processes that would minimize the ratios of
breakdowns and subsequently provide the high level of quality of an industrial
production. Yet, our will to learn from the work of one another has convinced us
that the notion of process was already present at various periods of time in
history. Since in the industrial context people have a long-term experience on
how to represent dynamic process-oriented situations from a start point to an
end point, we argue that, by means of a proper translation, it is then possible
to offer new perspectives on historical works, as long as they contain one or
more process dimensions. Furthermore, we assert that these perspectives pertain
to the Digital Humanities domain. Indeed, as Daniel Cohen says in his book
Digital History, the digital in history mainly
points to a representation of historical materials and investigations with the
help of “new” technologies [
Cohen and Rosenweig 2006]. To expound our point, we expressed scholarship evidence in a
process-oriented way to bring it into Digital Humanities material. We chose the
production of knowledge as a first field for our methodological investigation to
show its pedagogical virtues. In this contribution, we assumed that the case
studies we present may be regarded as a set of more or less ordered, more or
less planned, more or less tacit processes.
First, we would like to justify that assumption by reviewing works carried out by
historians and by showing that they could be visualized in terms of process.
Then we shall present some process-oriented representations and we will explain
the choice of one of them in particular. We will try to apply our methodology to
two particular works, dealing for the first one with information management and
for the second one with the industrial production of fabric. Last, dealing with
technicalities, we will show a way to translate our representation in a
technical fashion with the help of the last web standards and by presenting a
client-side prototype based on a specialized JavaScript library.
Process in the humanities
In this work, we define a process as a set of activities bringing about a result,
performed with accuracy and full control by actors who may interact with each
other as the links of the same chain. This chain of connected activities forms
in a long or short period of time, consciously or not. All actors of such a
process pursue a common objective which implies solidarities and sociability.
Therefore, we argue that if we manage to disclose such processes from the past,
we obtain information about the way communities were organized. Thus, our
purpose in this article is to propose means and rigorous methodologies to
visualize such processes in history. We chose to rest upon works of historians
to illustrate our method, although we could also apply it to primary sources.
Indeed, once we have identified relevant processes to highlight interactions
between actors, we are ready to visualize them with the help of our tool and
subsequently to question our sources on the basis on what was revealed by that
new display.
First, let us exemplify our point with cases that were studied by historians and
that are related to the production of knowledge.
Many works of historians deal with the production of knowledge at various periods
(Antiquity, Middle Ages, Renaissance, Enlightenment…) and in different areas
(Europe, the Islamic world, China…). In this section, we suggest that some
scholarly works could be represented in terms of process if we can agree to a
definition that would be both wide enough to model different situations and
sufficiently accurate to take into account the specificity of the humanities. In
a book published in 2000, Tiziano Dorandi analyzes various aspects of writing in
Greek and Roman Antiquity from the draft to the book edition [
Dorandi 2000]. In particular, he examines the conditioning of
papyrus, the format of its sale (roll or sheet), and the subsequent impact on
the writing of the Ancients. Then, he tries to describe the composition of a
treatise: from the gathering of documentation to the note-taking in order to
build a collection of notes, the author reviews practices of famous ancient
writers, such as Cicero and Pliny the Elder. For instance, he indicates that
Pliny was used to first making his assistants take notes on wax tablets before
dictating his commentaries on a new physical support from well-ordered notes. He
also envisages the passage from the sketch to the note-taking and finally to the
edition of a book and its diffusion towards various readers. Dorandi’s well
documented study describes the production of knowledge by ancient writers
grounded on robust ways of making. This invites regarding that production in
terms of process, if we consider such as an accurate, very often repeated and
constantly improved manner of achieving a particular task.
In an article entitled “Notes on Medieval Production and
Valuation in Late-Medieval Brittany”, Diane Booton investigates the
different steps followed by a priest in early fourteenth century Brittany to
produce a missal and a psalter [
Booton 2006]. The study is carried
out on the basis of “tax registers, ecclesiastical payment
ledgers and municipal account books.” From these sources, the author
identifies several groups of actors who might have participated in the
elaboration of the work: parchment makers, papermakers, scribes, illuminators
and bookbinders. For each of these groups, the author gives precise information
about its internal organization and its interaction with its social and economic
environment. For example, we learn that the wages paid to skilled and
experienced scribes represented a great amount in the total cost of the
production of a manuscript. We understand that the scribes were organized as a
team led by a coordinator who might also be in charge of “contracting with a music annotator, illuminator, bookbinder.” If we
see this situation in terms of process, we can assert that a process is
something which has the property to be connected. Indeed, the different groups
involved in the making of the psalter must achieve their own task and forward
the result to the next group. This is of course a sequential view of the chain
of processes which does not forbid that certain parts of the manufacturing can
be led in parallel (for instance, the making of the cover and the copying of the
manuscript).
Other works of historians dealing with the production of knowledge in other
cultural areas could also be quoted. As an example, let us mention the study of
Johannes Kurz who proposed in 2007 an article about “The
Compilation and Publication of the
Taiping
yulan and the
Cefu yuangui”,
in which he analyzes the constitution of major works (encyclopedias and digests)
in the Song period (late tenth century), and presents the personnel who was to
take part to it under the command of the emperor [
Kurz 2007]. This
article also alludes to the collection and selection of the sources that
prevailed in their fabrication.
These foregoing examples show that a number of human activities can be modelled
by a set of processes and from this point of view, it allows us to emphasize the
relationships between individuals in a historical, social and technical context.
Hence, our problem is to find a way of representing such processes in a Digital
Humanities framework. In this view, let us cite some process representations
that have already been tested and experienced in DH.
Many Digital Humanities programs were initiated in recent years, of which some
highlighted connections between actors, geographical areas or events and the
underlying processes. For instance, the
Republic of
Letters (already mentioned) consists in drawing up a mapping of the
correspondence between Renaissance scholars.
[3] This
program is strongly related to the social network analysis field which is a
relevant perspective for studying a community insofar as it accounts for human
relations and consequently the processes that govern their establishment.
[4]Another worthwhile example is the
Macroanalysis book
by Matthew Jockers in which the author applies digital tools to massive digital
libraries data and metadata, such as
Internet
Archive and
HathiTrust, to dig up
beyond the layers of literary well-known published works and account for “unjustly neglected” authors. Jockers determines the
frequencies of certain words, works on patterns and tabulates his results by
genre, date, nationality or origin of the authors. This work is inscribed in the
“distant reading” program as defined by Franco
Moretti in his
Graphs, Maps, Trees
[
Moretti 2005]. In the chapter dedicated to
Trees, Moretti rests on Darwin’s
Origin of
Species, and specifically on the
Divergence of
Character section to analogously address the issue of literary
survival. He chooses British detective fiction as a field of investigation and
builds a tree to distinguish the novels that use clues from others, which
enables him to highlight that the latter ones were all forgotten. In the second
level of branching, he refines the character of divergence and classifies novels
with necessary clues and not necessary etc… This tree accounts for literary
transformation under the “pressure of social
selection”. As in Darwinian evolution, that transformation seems to
be the result of a long-term
process of which the causal factors
must be identified and analyzed. In that case, the “process
term” refers to a “natural” evolution not
deliberately ordered nor commanded by a community of human beings. For that
reason, the tree diagram acts as a classification scheme according to a certain
criterion, that is, the divergence of a character. It represents the outcome of
one or more underlying processes the nature of which we do not know. But, this
tree diagram describes in no way a process in action. Indeed, mapping relations
between Renaissance scholars or building tree diagrams such as above reports the
macroscopic dimensions of human and social organizations.
In contrast, in this essay, we intend to concentrate on the processes that human
communities set up for a precise objective and that dynamically account for an
action being made. In this way, what we propose can complement the tools and
methods that we have just mentioned above (such as tree diagrams or network
mapping) insofar as we focus on the process itself in such a way that we can
disclose the atomic dimensions of the situations we investigate. Thus, we
consider interactions between elements that may be either individuals or
material resources or even more abstract entities such as activities. The choice
of such interactions enables us to account for complex situations (behind which
we find individuals, organizations or external constraints) that we describe
with an identical framework whatever the details that we obtain from historical
works.
Therefore, we think that modern methods of process representation could
contribute to highlight the interactions between these various elements and, as
such, that they would give a relevant description of past collective enterprises
like, for example, the production of knowledge.
The choice of a process representation
In order to make a choice of a process representation for visualizing scholarly
works, we should first consider what a process means in our contemporary world
and especially in the industry where the need for formal and rigorous methods is
crucial.
In a modern wording, a process may be defined as a series of linked activities
and resources (either material or human) which transform input elements into
output ones [
Oakes 2013]. Thus, an organization or a collective
activity may be modeled as a set of processes evolving in an external
environment (represented by constraints that must be respected) focused on a
specific objective. The interaction between processes may be regarded as a
communication channel in which a flow circulates. It raises the problem of the
relevancy of these modern concepts for representing works in history such as
those briefly described above. In fact, we do not mean to represent the past
world but only “to construct an interpretative
framework” for accounting situations described in scholarly works.
This “epistemological” position is clearly related to
the status of modeling in the humanities. Following Michael Gavin, we argue that
our process-based model “do[es] not represent the past, but
our ideas about the past” and, in our case, ideas derived from
scholarly works [
Gavin 2014]. Therefore, when we talk about
“representation”, we mean a way of representing the
processes that constitute our “interpretative framework”. As
a matter of fact, modeling in the humanities does not appear as a novel
activity: for example, using “categories to delimit a
conception of the world” is already an activity of modeling [
Gavin 2014]
[
McCarty 2005].
There are several ways of representing processes. All of them correspond to
different points of view. We can quote, for instance, those focused on heuristic
conceptions, usually called mind maps. They are very relevant to account for
decision processes but do not seem to correctly represent situations and
activities already well experienced as those we would like to illustrate
here.
[5]
The
Unified Modelling Language (UML),
[6] mainly
related to software development, specifies several diagrams dedicated to precise
situations (static, dynamic, sequential, interactive...). In particular, the UML
workgroup recommends to the user the Activity Diagram in order to highlight the
chaining of activities of a system. It is useful to model an interactive
process. More precisely its features are close to those of a flow chart or of an
algorithmic tree.
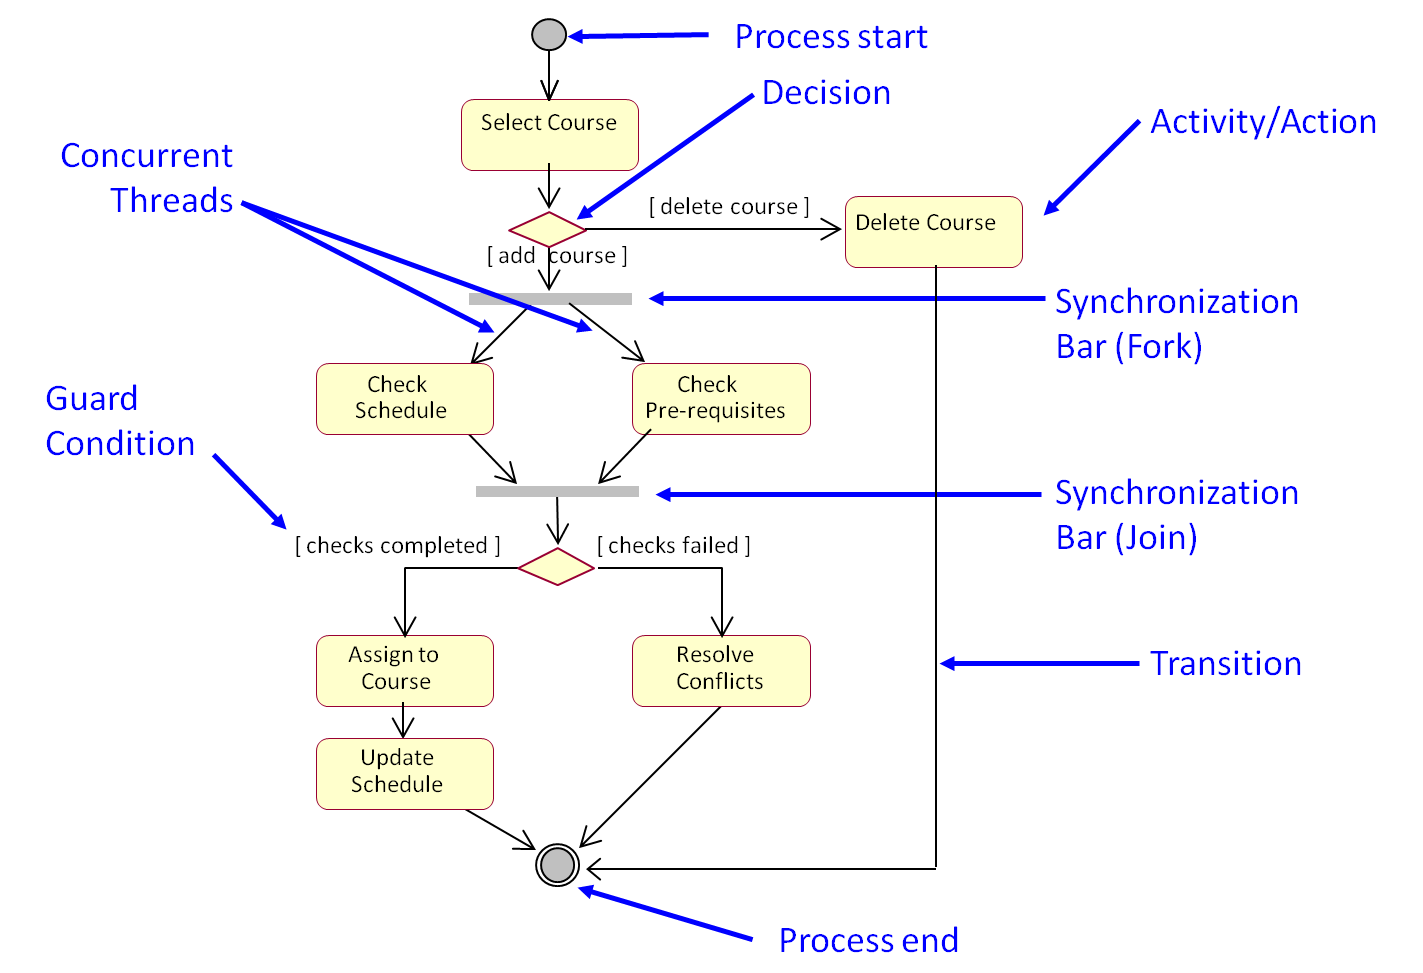
Figure 1 is an example of an
activity diagram which accounts for a course registration process in an academic
institution. Each rounded rectangle represents an activity, that is to say, a
step of the process, whereas the rhombus-shaped figure stands for a decision
split on the basis of an exclusive choice (an XOR operator in Boolean terms).
The grey bars symbolize synchronization steps while the black thin arrows play
the role of input or output elements.
Although UML focuses on software and system designs, it can be extended to other
purposes.
[7] For example, a more business oriented approach
has been standardized by the
Object Management
Group as the
Business Process Model and
Notation (BPMN) to provide “the capability of
understanding the internal business procedures”.
[8] As the UML
Activity Diagram notation, BPMN offers several components to model
a process oriented view in a business approach. At least, we can cite the event,
activity, gateway and connection elements. The event elements (represented by a
circle) denote something that happens: the Start event is the process trigger
whereas the End event is the result of the process. The activity elements
(rounded corner rectangles) describe the work that must be done. The gateway
elements (diamond shapes) determine forking and merging of paths depending on
conditions (exclusive, event evaluation, inclusive…). All these elements are
linked by connection elements (sequence, message passing, and association) to
describe the overall process.
[9] The UML and BPMN methodologies, which share common roots (as they are
standardized by the same consortium), appear as good candidates for our
subject.
As a matter of fact, we preferred a methodology of representation derived from
the quality of process and we will try to justify our choice further. The
quality of process ensures that, for a certain probability or more precisely at
a certain error rate, which must be minimized, a process will produce the
expected output element. The philosophy of such a representation consists first
in observing what already exists and then, upon these observations, in
establishing a diagnosis of what must be improved. For this purpose, such
methods provide robust ways of building a framework or a model for apprehending
reality. With this process representation, we can position ourselves as
observers of experienced situations and not as designers of a system, which we
cannot pretend to be when scrutinizing the past. In the industry, minimizing an
error rate may be characterized as a “progress”. It is
achieved by adopting a “broad vision of the company” that
enables obtaining more control of its activities by a fine analysis. This
“business process approach” is of course rooted in our
contemporary world and we must maintain a necessary critical distance if we wish
to adapt it to our subject. And to do so, we must first state precisely that, in
our case, “progress” cannot be related to any
“improvement” in terms of quality, for we do not intend
to make an audit of the past scholars. We only wish to set in motion a current
methodology of quality improvement to visualize past activities. In that
perspective, the “broad vision” offered by that methodology
meets the expectations of historians using Digital Humanities techniques for it
implies a fine and rigorous analysis of all related activities.
Let us now briefly describe the methodology. Companies implement process
referential and maps, which define the interactions between processes, show and
reveal the overall coherence. It is a tool of communication and therefore it
represents the synoptic view of all business processes (sequence and
interactions between processes).
Processes and roles relating to these are generally independent of the
organization and functions. The method of process representation that we
consider here is inscribed in an overall toolbox usually declined in five phases
of which the main and key objective is to converge to a
“zero-defect” approach in a chain of production.
[10] To that
purpose, the expert must build in the first phase a process map of the
production, and then analyze it in order to improve and optimize the quality of
making. We would like to focus on the first phase of the toolbox that proposes a
robust set of tools to establish such a map.
In the reality of industry, the project manager must ensure that basic questions
such as “the project relationship with the overall objectives”, “the
nature of the problem” and the “goal” have been understood by all
stakeholders. Hence, it follows a progressive approach, including multiple
steps, each of them being focused on a specific problematic.
[11]
During the so-called first phase, the project manager starts by understanding the
current process and its related characteristics (process boundaries, the way
products and services are actually delivered, etc.). For that, several tools are
useful to visualize and point to the process that needs improvement, to identify
start and stop points of the process under consideration, to identify the
customers of the process and to ensure a shared understanding of key elements of
the process, including what it looks like and what it should deliver. These
tools are the “SIPOC”, the “high-level process
maps” and the “detailed process maps”.
[12]“SIPOC” stands for Supplier, Input, Process, Output, and Customer. It deals with business process
representation as the logical organization of suppliers, inputs, and work
activities designed to produce a required end result (product or service output)
for internal or external customers.
Then, the “high-level process maps” and “detailed process maps”
representations propose a focus on the process itself detailing its activities,
main flows, and other elements.
The SIPOC, as a first representation, greatly helps to understand the process
context. This is very important, as chains of process in companies are quite
usual, meaning that the outputs of the first become the main inputs of the next
one, etc. To be brief, we can state that, in the SIPOC wording, Supplier provides inputs to the process, Input spans materials, resources, and data necessary
to execute the process; Process is a collection of
activities that accepts one or more inputs and creates output that is of value
to customers; Output is related to products,
services or data resulting from a process whereas Customer points to internal or external entity that receives
outputs.
When focusing on the process itself, the “high-level process maps” and the
“detailed process maps” representations are useful. An example of a
process map that we will use and detail further in the present article, is the
flowchart. A process flowchart
includes several key elements which are the main activities and milestones of
the process; the flows between activities, e.g. main inputs and outputs; the
roles associated with the various activities; the different elements supporting
the run of a given activity.
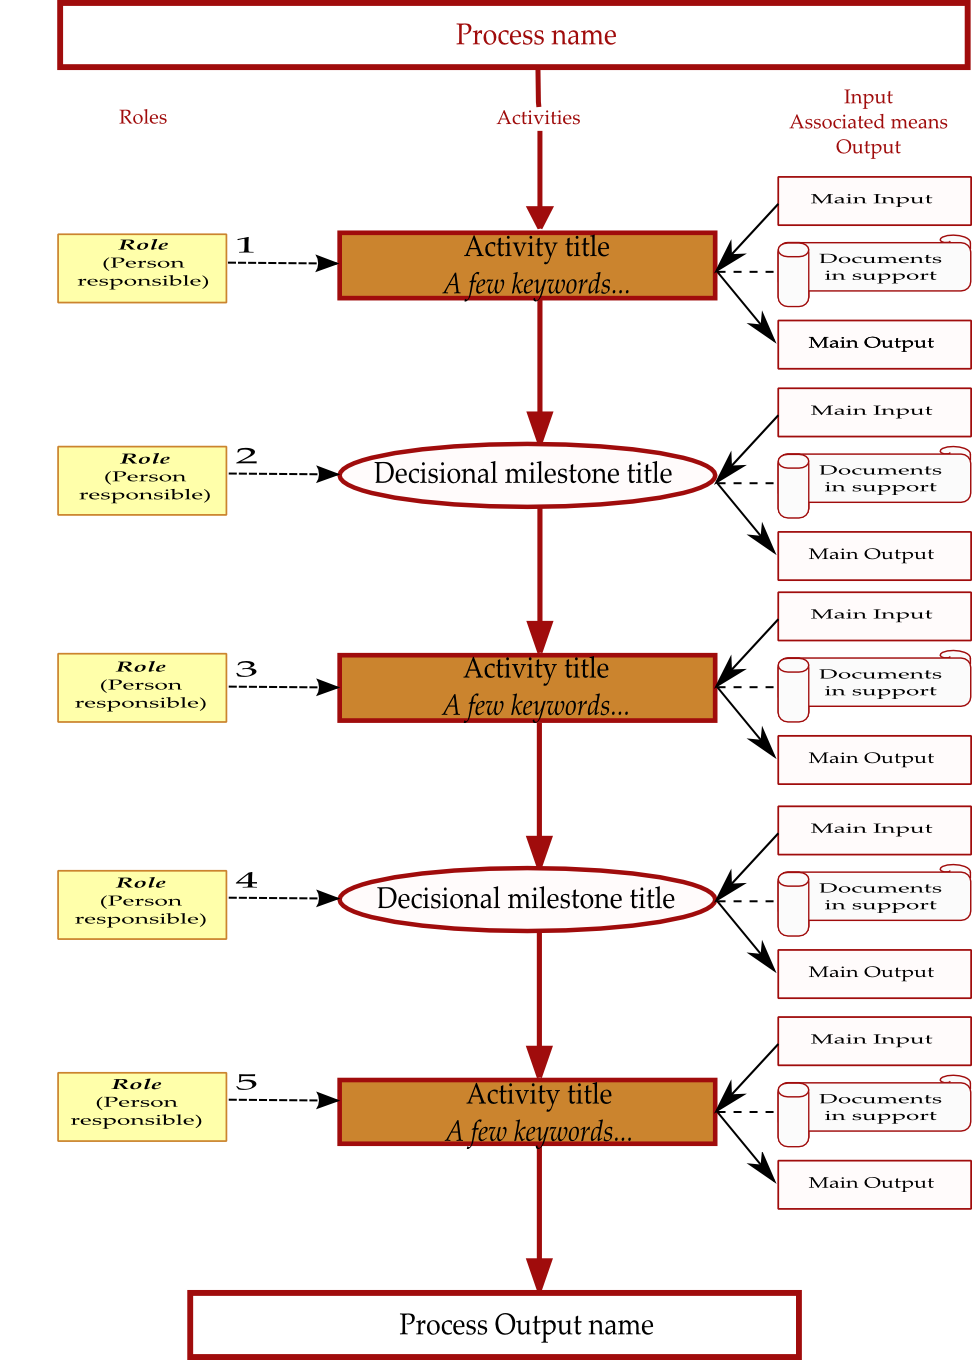
Figure 2 is an example of the flowchart template
used to represent the various processes in the
Thales Group
Chorus 2.0 referential.
Table 1 is the
associated caption.
 |
The role(s) associated with an activity. The person responsible has to
be highlighted (bold, italic, underline…). Each activity, including the
decisional milestone, has to be associated with one or several
roles. |
 |
Activity title: Short (50 characters max), typically using an
“action verb” and a complement, “A few
keywords” as typically a set of substantives allowing to
understand the activity main content. |
 |
Case where, for this activity, a lower level description is available
(flowchart and procedure). |
 |
Decisional milestone title: Short (50 characters max), typically using
an “action verb” and a complement. |
 |
Document (instruction, guide, template, form, manual, example) or
folder supporting the activity execution. |
 |
Indicates for each activity, decisional milestone, the main associated
input(s). |
 |
Indicates for each activity, decisional milestone, the main associated
output(s). |
Table 1.
“High-level process maps, flowchart principle” 2/2
To summarize our choice, we state that we intend to apply a method used in the
industry to describe and to visualize particular situations reported in
scholarly works. This method consists in coupling a generic and macroscopic
representation (SIPOC) with a more detailed process map (namely a flowchart)
specifically developed and thought of by the Thales Company.
[13] The main benefit of this flowchart on BPMN is its ability to
make visible, in a simple way and on the same diagram, the roles (namely the
main actors and the stakeholders), the activities with their inputs and outputs
and the implemented means. In addition, the flowchart is situated at a rather
satisfactory level of accurateness but it is also sufficiently macroscopic to
provide an overall view that corresponds to the expectations of any Digital
Humanities practitioner whose objective is to comprehensively render precise
results. In addition to its intrinsic simplicity due to the vertical layout, all
these reasons inclined us to implement this representation in the framework of
Digital Humanities.
Case studies: application of the SIPOC-Flowchart representation
Indeed, in their work on Slavery in American Society before the Civil War
conducted at the University of Virginia, W. G. Thomas and E. L. Ayers argue that
one of the activities of a Digital Humanities project is the translation of “professional scholarship-evidence into forms that take
advantage of the possibilities of electronic media”
[
Thomas and Ayers 2014].
[14] This translation may be achieved
by a relevant arrangement of the information system. In a basic information
system architecture, we usually identify several components. Among them, we find
the data model which organizes the interrelated pieces of information (usually
in a database) and the “view” which displays results extracted from that
database according to a query. The view component has gained huge importance so
that it usually influences the design of the data model.
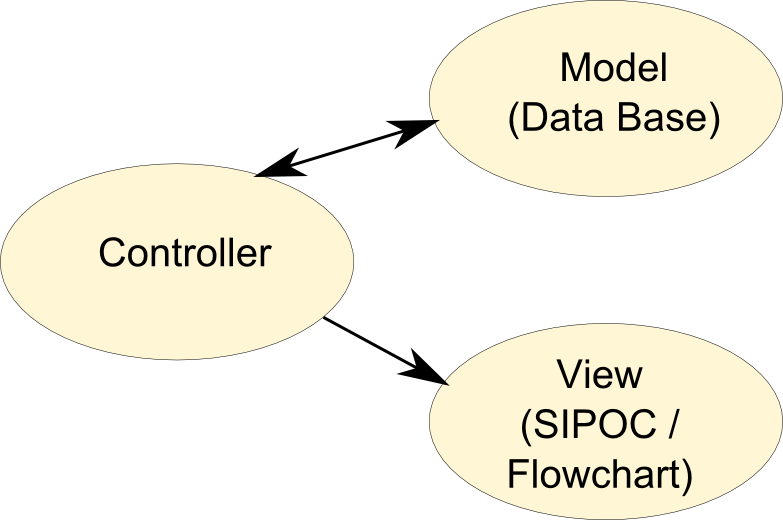
[15]
Figure 4 represents a schematic articulation of the main components for our
Digital Humanities pattern.
In this section, we shall see how our process-oriented methodology can offer the
opportunity to build a view component with the intention to visualize historical
data.
We shall exemplify our methodology on case studies drawn from Ann Blair’s
Too much, to know
[
Blair 2010] and we will try to extend it to another scholarly
work.
[16]We first chose Too much to know because it embraces
most of the aspects related to the production of knowledge in a particular
period, that is, the Renaissance. Ann Blair’s book is indeed about scholarly
information management before the modern age. The author devotes five
well-documented chapters on that question. In particular, in chapters 2 and 4,
she gives a lot of insights on the note-taking activity regarded as a central
step towards information management (chapter 2) and on compiling, which can be
viewed as a following step resting on the output collected from the note-takers
(chapter 4). These chapters are documented by numerous and detailed examples
which give hints on how the different actors could manage the abundance of
information. We would like to reread these chapters from the perspective of our
methodology, first by drawing a generic SIPOC scheme. The main objective of this
generic scheme will be to offer original views of historical data and, probably
in a further work, to build an atlas of processes set up by early modern
scholars. Its only virtue will be that of positioning the different activities,
as parts of the process, in the global process that leads to a final tool of
information management. On this basis, we will examine a case study for which
some of the previously detailed phases are consistent with historical
materials.
Generic SIPOC
In chapter 2, the author sets the bases of a history of note-taking, as “various kinds of writing in response to listening,
reading, or thinking…for the production of a composition or
report”
[
Blair 2010, 64] pointing to the difficulty of such a history due to the loss of material
or its immediate destruction inherent in its use. Indeed, as mentioned, “erasable writing surfaces were commonly used for
temporary notes”
[
Blair 2010, 65].These surfaces were wax tablets bound in a codex form, pocket-sized
writing tablets, slate blackboard, sand tray…In addition to the fragility of
those writing surfaces, the discarding of notes, which was common among scholars
and especially their heirs, is another feature that makes the taking-note
process difficult to analyze [
Blair 2010, 66]. Another reason
which accounts for the loss of notes is their “physical
integration into a manuscript used for printing” as illustrated
through Pierre Bayle’s
Dictionnaire historique et
critique
[
Blair 2010, chap.4]. We can already anticipate that
“taking notes”, “discarding notes” and “integrating notes”
will be categorized as activities in the SIPOC representation whereas the
so-called associated means will be represented by all kinds of
“erasable surfaces”: on one hand wax tables, sand tray,
slate blackboard as mentioned above, and on the other hand “loose sheets stored in bundles” and notebooks as stipulated further.
What could be the roles corresponding to those activities in the SIPOC
flowchart? If we read Ann Blair more thoroughly, we learn that the notes taken
by readers on erasable surfaces were often destroyed. Those “first-order” notes, as characterized by the author, served sometimes
as a basis to “second-order” notes put on a more
durable surface. These could also be put into circulation after revision and
authorization by the speaker [
Blair 2010, 64–65]. So, the
listeners (students, secretaries…) in conjunction with the speakers may be
considered “roles” in the “first-order” and/or
“second-order” notes production activities. In
some cases, the author gives details on how scholars took notes or made
annotations when reading a book: sometimes they highlighted passages with
keywords in the margins to produce a running index [
Blair 2010, 71]. One feature relevant to the process-oriented note-taking
activity is the debate between scholars who advocated reading without
interruption and those who, in contrast, recommended stopping reading in order
to excerpt and to copy passages in a notebook [
Blair 2010, 72]. Note-taking most often took one of two forms: either “by
epitome or abridgment,” that is, by paraphrasing or summarizing the
sources, or “by head or commonplaces,” that is, by
copying passages from the source into a notebook under a commonplace heading.
These ways of working shed light on the “note-taking process”
that we will link to the “first-order” notes
activity.
As the quantity of notes increased, it became of central importance to set up
tools for their management. One crucial tool was the assignment of headings to a
set of notes. As Blair mentions, the choice of such headings was rarely
discussed by scholars, although it was “crucial to effective
note-taking” and required judgment, as part of a decision process
[
Blair 2010, 88]. Another important decision involved the
number of headings to be used: to be useful, headings had to be chosen
accurately and their number had to be great enough to guarantee sufficient
subdivisions, but small enough to prevent the storing of too many notes under
the same topic. Another tool for managing notes was their indexation which
supposed that each passage of a notebook “would be entered into the index under a keyword”
[
Blair 2010, 91]. One way to do so was to alphabetize the passage “under its principal thing” and to draw up an index on “sheets corresponding to each letter of the alphabet”
with references to the notebooks. That way, the index could “receive new headings over time”. This indexation of a notebook is
therefore described as a living process which, together with the constitution of
headings, corresponds to an activity in a SIPOC that could be entitled “notebook management tool elaboration”.
What was the main purpose of excerpting and accumulating notes in notebooks?
Blair tackles that question further in chapter 2. The historical materials she
presents in her development depict the notes taken by scholars as “an aid to writing”, as worded by a subtitle of the
chapter. In our view, that “aid to writing” is one
branch of the process of writing, and may be considered one of the steps that
describe, in the SIPOC, the achievement of a reference book in early modern
times.
In chapter 4, more focused on the compiling activity, the author gives many hints
on the methods used by compilers and on the social and technical context they
were acting in. In particular, she discusses some social and legal elements,
which, to our view, should be included in the process description by a SIPOC.
For instance, the questions of obtaining privileges, which were only valid
within a certain jurisdiction [
Blair 2010, 179], or of
avoiding censorship [
Blair 2010, 204] were determinant in the
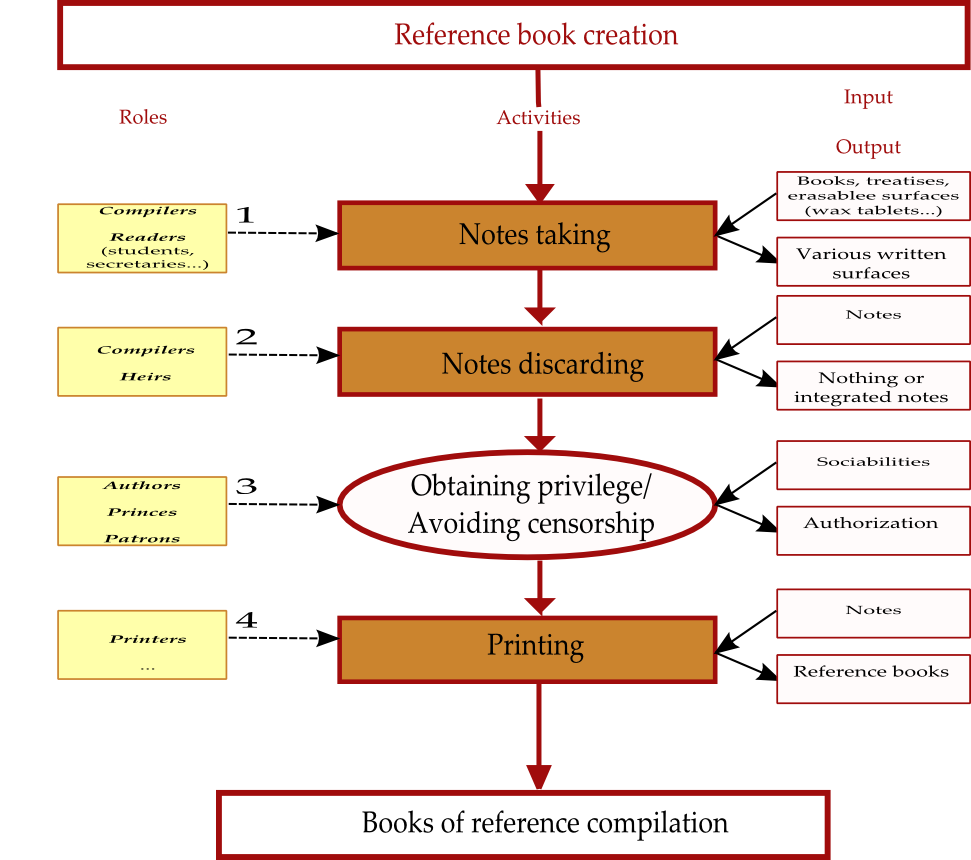
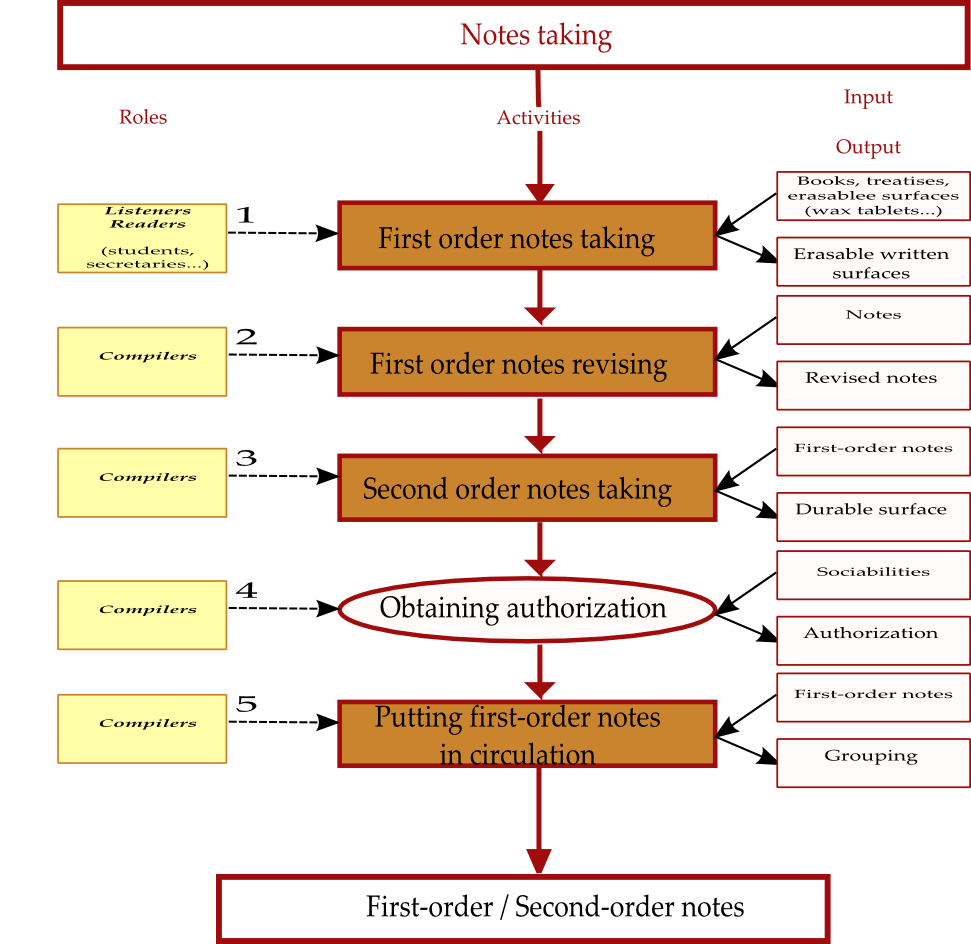
making of a reference book, although not purely technical. In figure 4, we
propose to represent the main steps of the reference book creation process, as
an application of the SIPOC diagrams presented in the previous section. In the
SIPOC symbolism, the blue frames represent activities that may be described by
another flow chart, that is, that have a degree of complexity which justifies a
detailed process representation.
Regarding the compiling activity itself, it may be considered the result of
collaborations either diachronic, when “compilers relied on earlier work”
[
Blair 2010, 208], or synchronic, when compilers relied on amanuenses [
Blair 2010, 209]. So, earlier works such as notebooks, or
aids from helpers, may be categorized as inputs in our SIPOC-based reading.
If we look more precisely at the technical activities as practiced by the actors,
we find some rather basic ones, such as “selecting a passage from a source and assigning the
passage to a topical heading”
[
Blair 2010, 210], but also some new techniques based on “the use of
slips and of cutting and pasting from printed books.”
Thus, to describe an overall process, we can consider flow charts at several
levels: at the top level, we represent global processes whereas more detailed
processes may be specified at a second level by another flow chart.
This is described in figure 5 where we translated the note-taking activity
according to the elements of Blair’s work previously reported.
As we can see in figure 5, each activity is still framed by a blue rectangle
which means that we consider possible another level of accurateness. Below, we
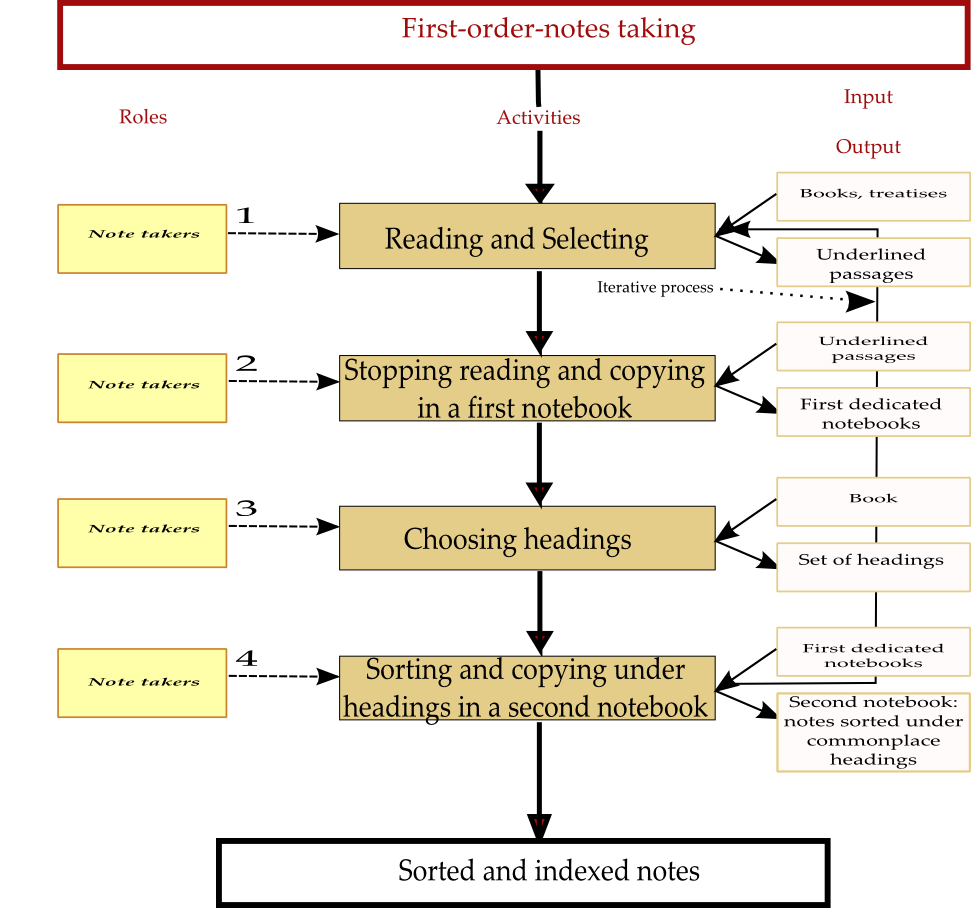
exemplify that third level flow chart with Sacchini’s “first-order-notes taking” activity.
A case study
This foregoing review of Ann Blair’s chapters 2 and 4, translated into a process
oriented representation, gave clarifications on the sequences of the activities
(at different levels) that yielded a final intellectual product corresponding to
the expectations of scholars in early modern Europe. But this generic
representation based on SIPOC and flow charts only assigns a correct position to
each component in the global process (roles, activities and associated means)
provided that the component is effective in the process. If we focus now on a
particular case with the intent of building its relevant SIPOC, we should be
able to visualize its shift from the generic representation. In particular, we
will inevitably have to contend with gaps in historical information, which
amounts to the absence of certain components in the SIPOC flowchart. The choice
of a particular case could be made in function of different criteria. For
instance, we could follow the process of one scholar or a group of scholars who
committed themselves to a particular production. That kind of process would
spread over a certain geographic area, over a short period of time (that of the
scholar’s career). In contrast, we could also take into account the achievement
of a book over a long period of time, such as Theodor Zwinger’s Theatrum Humanae Vitae, which, as related in chapter
2, spanned over almost one century and a half, or the Polyanthea produced during 178 years.
For the sake of “simplicity” (if the term is relevant for such
a study), we propose to focus on the Jesuit Francesco Sacchini as a note-taker.
Sacchini’s way of taking notes contrasted with that of others as he recommended “the interruption in reading that resulted from stopping
to copy a passage into one’s notebook: it slowed down reading and aided
retention”
[
Blair 2010, 72]. In more detail, we learn that Sacchini recommended taking notes in two
steps: first he selected passages and wrote them out on a notebook “in the order in which they were encountered”, and
second he copied the passages out in another notebook under commonplace headings
[
Blair 2010, 77]. If we read Blair’s account correctly,
we assume that Sacchini read a passage once and wrote it twice as just
mentioned.
[17] The selection process was materially performed by
underlining the passage of interest in a book [
Blair 2010, 86]. Then, as we pointed out in the previous section, the choice of a heading was
also an important step in the process. Concerning Sacchini’s method of heading
choice, Blair alludes to it [
Blair 2010, 89], but it is
likely that we do not have sufficient materials to give a thorough development.
It is anyway worth mentioning and positioning it in the flow chart, even if we
are not able to provide a focus on it. It is likely that the choice of a heading
was made when copying the passage out for the second time, enhanced by
familiarity with the text acquired during the first round of note-taking. That
iterative process is described by figure 6.
In this section, we showed that the process oriented view, which is the SIPOC
diagram coupled with flow charts at different levels, proved to be a powerful
candidate to visualize and represent data at the front-end of a digital system
where historical work must be stored. Beyond its advantages in terms of
visualization, it compels an accurate and rigorous analysis of activities, and
in so doing, it enables setting up a powerful focus on specific cases.
Therefore, it provides the scholars with a tool reference for comparing
different cases and for raising subsequent questions. In addition, that tool
does not concentrate only on individuals, but it defines, in a broad meaning,
activities and roles related to each other, which gives an account of the
interactions between the actors and their environment. Last, one more advantage
of such a methodology lies in its ability to provide a global and overall
representation of a past enterprise.
However, we must be careful when using this methodology. Indeed, the first
problem we encounter when we try to apply the SIPOC and flow chart
representation is related to the effort we must make to deeply understand all
its subtleties. Indeed, this methodology was not first designed for historical
works: it is then necessary to adjust it to the needs of historians (for
instance, by redefining some of the vocabulary). Furthermore, it rapidly proves
to be inoperative if the amount of scholarship evidence is not sufficient, as it
is demanding many details to be enlightening.
Another case study: the industrial production of fabric
This foregoing and detailed part has shown that the SIPOC-
flowchart representation is well-adapted to a certain type of
scholarly work, namely any work related to the production of knowledge. But, we
can now legitimately examine whether that method of visualization could be
applied to other works. To answer this problem, we favored a pragmatic approach:
as our point is not to build a theoretical framework within which we would
demonstrate logically the validity and the relevancy of our method for a general
case, but rather to show that it can help visualize results of selected
scholarly works in a thorough way. To that end, we put our attention on a recent
publication, “Copy and Counterfeit in the
Renaissance”
[
Duclos-Mounier and Nativel 2014], which collects the proceedings of an
international conference dedicated to this topic. It is a 500-page volume
divided into two main parts: the first one is theoretical and deals with art,
book, or science and religion history; the second one, more practical,
investigates different cases of literature, book, art, science, religion or
economy counterfeit. One of these case studies describes and analyses “textile copy and counterfeit in the Renaissance”
[
Jeggle 2014]. In this chapter, the author makes the distinction
between imitation and copy or counterfeit. In certain cases, imitation consists
of the substitution of raw materials used to make the textile. For example, the
origin and the quality of the fiber used to make the textile were of first
importance: making products with wool from another origin than expected (maybe
cheaper) was a constant temptation, but these products were usually considered
falsified. Another example: were the silk threads made with first choice silk or
with scrap material? In Italy, the regulations demanded that thread be spun with
pure materials, which implied thorough controls. The next step in textile
fabrication was the weaving phase. It was then possible to circumvent the
quality standards by introducing threads of different quality levels or by using
less thread than recommended. We learn from the chapter that it was a source of
numerous conflicts within the production centers. After the weaving, many
textiles were bleached or dyed. The quality of the dying was also a matter of
discussion: some colors could be made with different materials. Their durability
and the damages caused by the subsequent chemical reactions were variable and
influenced the quality of the final result. Last, high quality textiles needed
fine finishes of which the quality determined also that of the product. During
these last phases, there were numerous opportunities for counterfeiting: quality
of the textile and quality of the fabrication procedures were the main
parameters to play with for copying original products. To prevent these
practices, the authorities had organized committees that examined the fabric
quality. They had set up production standards and inspection organizations that
certified the products and, when necessary, they declared fraud perpetrations.
For instance, in Augsburg, woolen sheets were inspected at several times during
their production: these inspections mainly involved the material quality of the
fabric and also the quality of its treatment. Surely, the practices of
inspection and certification were different according to the areas and the
production places. The inspection and its subsequent certification were
materialized by seals printed on the fabrics with ink, wax or lead. The wax
color indicated the quality level.
As the reader can anticipate, this chapter of the book is rich and full of many
details that can lead astray someone not familiar with that scholarly topic.
After that first general presentation, the author expounds a detailed case study
focused on linen production in Westphalia. As our purpose is not to summarize
that fascinating study, we only would like to benchmark our method of
representation to the previous general considerations.
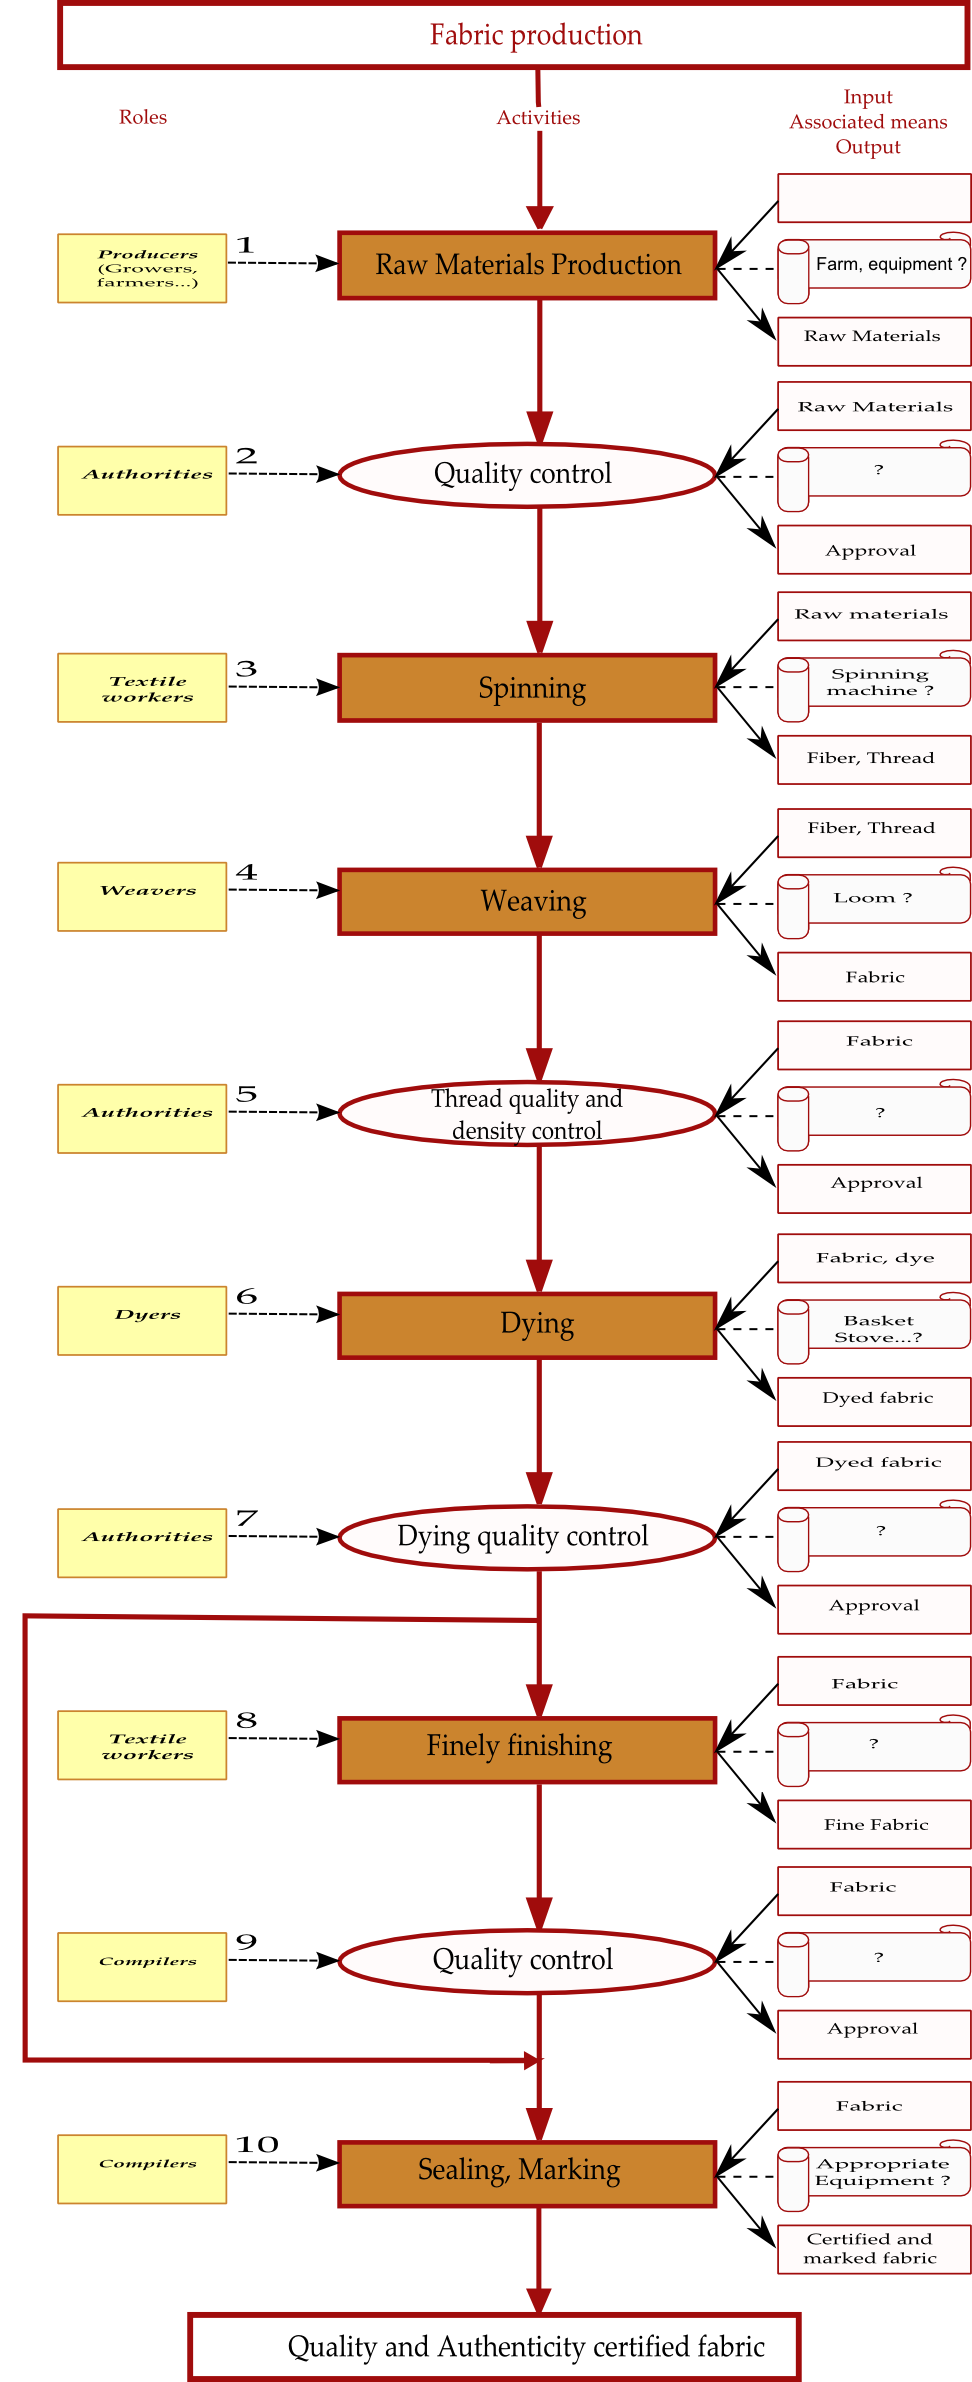
In figure 7, we tried to render these considerations in a SIPOC-flowchart
representation.
In this diagram, we chose to define six main activities controlled by four
milestones corresponding to the different inspections and certifications that we
briefly presented above. This flowchart rests on the principle that a process
which would successfully pass all these phases would produce certified and not
counterfeited fabric. All these activities are represented as general ones,
which means that they may be unfolded into subactivities to provide more
details. This could be achieved, for example, by extracting the information
contained in the footnotes of the chapter. Note that the bypass arrow between
the “Dying quality control” and the “Quality control” milestones
models a “normal” fabric, namely a fabric that has not been
finely finished. On the right side, we attached to each activity its inputs,
outputs and its associated means (in a parchment symbol). Note that the question
mark we appended to the associated means state that the author of the chapter
did not clearly mention them. However, when we figure out in terms of process
the situation that he describes, the question of the means implemented by the
textile workers must be raised at the precise place pointed by the flowchart.
This is another virtue of such a representation: the gain of an overall view
inclines the reader to raise questions that pertain to a specific point and that
did not arise the first time.
Technicalities: data model and the SIPOC-flowchart representation as a
frontend-view
For more than forty years, digital system architects or designers have adopted
common methods to build databases according to standard models. As previously
mentioned, an information system, that is to say the core of any Digital
Humanities project, usually rests on three main components (see
figure 3). First, the data model, mainly a
database, contains the scholarship work organized according to a rationale.
Then, the view acts as an interactive component between the data model and the
end-user. It is a simple web page, a rich interface application (or RIA based on
JavaScript framework) or a traditional graphical user interface (java based for
example), depending on the level of sophistication. Last, the controller is the
component that connects to the database, retrieves the data relevant to the user
query and prepares them for a display on the view. The main advantage of such
architecture lies in its ability to distribute the overall development among
different specialized skills (database design, programming and view web-based
design). We have already presented the process map methodology as the view
component relevant to certain historical works. Let us now briefly describe what
could be another central brick in Digital Humanities: the organization of
historical evidence or the design of specific databases. In human sciences, the
databases must essentially follow the relational model based on the second
and/or third normal forms [
Codd 1972]. From this architecture, it
is then easy to produce XML or JSON files,
[18] provide them with
vocabulary or ontologies, implement an efficient search engine to retrieve data
and make them capable, through relevant protocols, to open a dialog with other
web-based applications and exchange data.
[19]
Those technological “novelties” may not be regarded as simple tools by the
historians any longer. At least, they offer new visions on the historian works,
new ways of analyzing and new ways of researching [
Cohen and Rosenweig 2006]. If
we focus on our SIPOC approach, we can notice that the foregoing
flowcharts are good candidates for segmentation in atomic
entities as recommended by the relational second and third normal forms. Indeed,
we can anticipate, in the case of a database design, that activities would be
modeled by an entity which would cover several attributes such as its title, a
description and probably other useful fields. That entity would have a
relationship with others: a “role” entity, an “input” entity, an
output entity and a document entity. These relationships would be attributed
cardinalities whose values would depend on their nature. As it is obvious that a
role may be linked to several activities and, reciprocally, an activity may be
performed by several roles, the relationship activity-role will be of type
“n-m” with a “0-N” cardinality on each side.
[20] Concerning the input, output and document entities, we
can consider, for the sake of simplicity, 1-n relationships with the activity
entity, which means that an activity is related to, at most, one input
(respectively output or document) and that the input activity may be linked to
another activity. As a consequence of such a choice, the field that describes
the input (respectively output or document) must be multivalued in order to
account for the fact that, in reality, several inputs may correspond to one
activity.
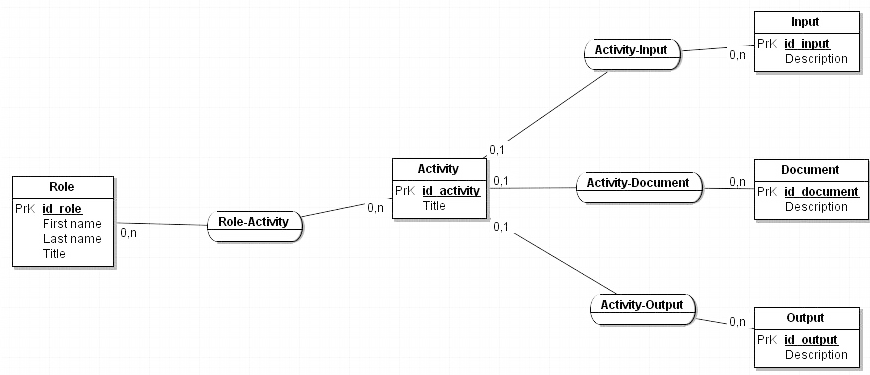
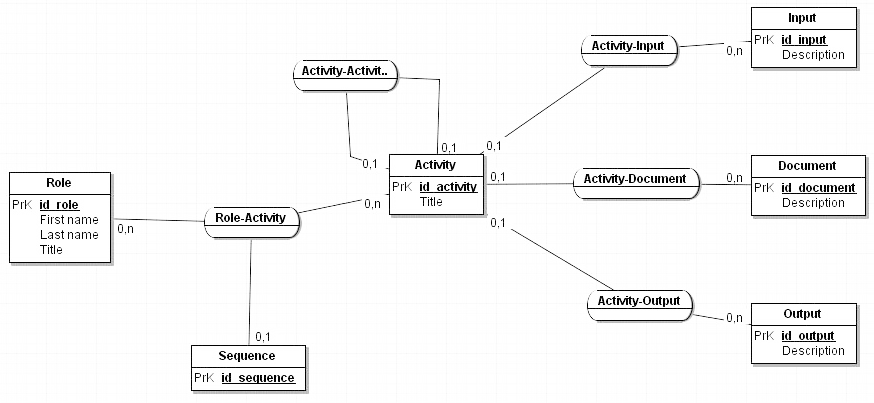
[21] The entity-relationship scheme
that represents that model is as below:
The diagram above must be made more complicated if we want to account for the
sequence of the activities, as it appears in the flowchart process. One way to model that sequence consists in
assigning a “sequence” entity to the “Role-Activity” relationship. In addition, as seen previously, an
activity may be expanded in “subactivities”, which amounts to create a
“tree” of activities of which we limit, for clarity
reasons, the number of branches to 3. The modeling of such a feature may be a
reflexive relationship on the activity entity itself. Therefore, a more definite
entity-relationship model might be represented by figure 9:
To practically exploit such a model it is necessary to convert it in a relational
database (using the well-established rules), then to fill it with data. In order
to represent a particular SIPOC, one could develop an engine which would
retrieve the relevant data in function of a user request and which would
generate an HTML page to display a flowchart. Indeed, the recent HTML5 standard
includes a “Scalable Vector Graphics” (SVG)
[22] engine that is able to
produce image on the fly. Thus, if the engine gets good geometric data
calculated from the database, it is then possible to generate flowcharts upon
requests through a well-designed interface.
One way to draw automatically a
flowchart in
SVG format would be to provide the application
controller with a converter from relational to JSON format. Having
JSON data retrieved on the client side (namely in a
browser) enables drawing a flowchart in SVG/HTML format, provided we wrote
JavaScript code based on libraries specialized
in data visualization such as the
Data Driven Documents
JavaScript Library (
d3js).
[23] In order to show the feasibility of our
assertion, we remained pragmatic and we developed a quick prototype based on
d3js. We assumed that a
flowchart could be stored in a
JSON array
where each element (namely each
JavaScript object)
stands for an activity and its associated means and roles. Therefore, in a
JavaScript section of an
HTML page, a
flowchart could be represented
as below:
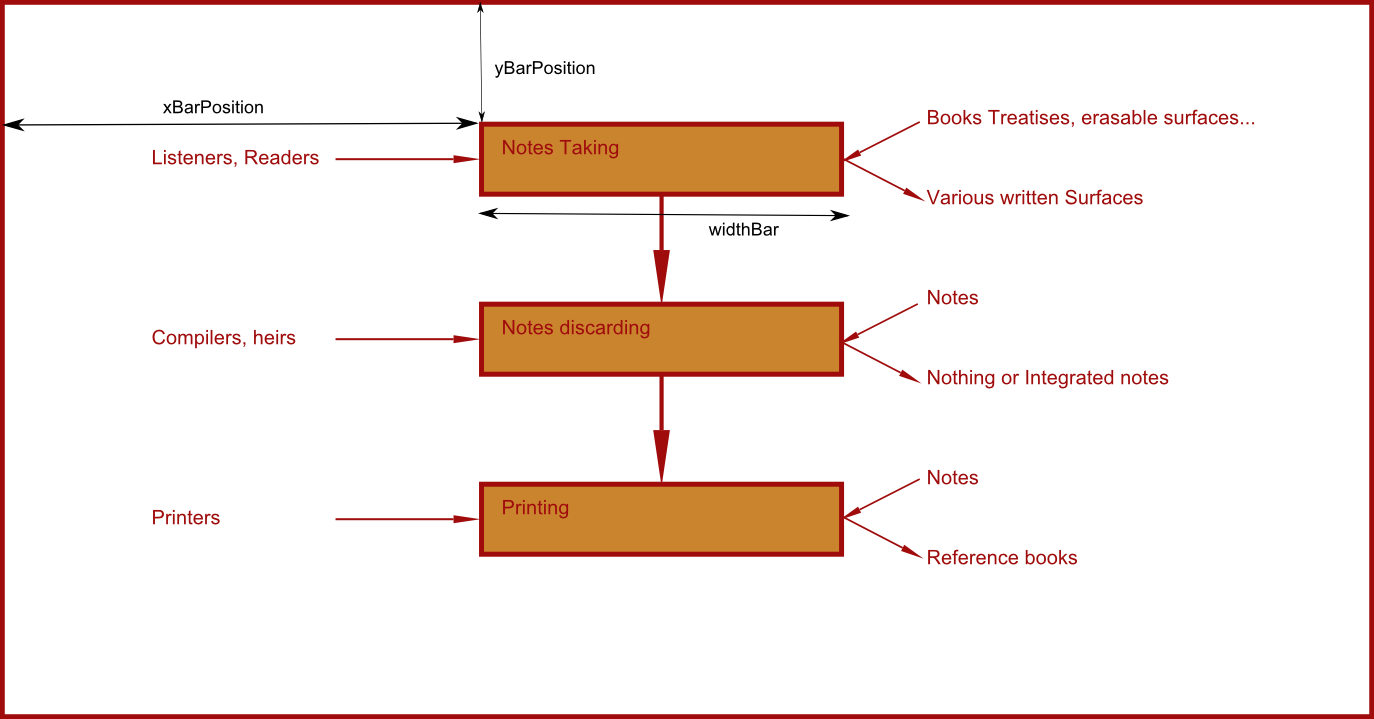
var sipoc = [ {"activity":"Notes Taking", "MeanIn":"Books Treatises, erasable
                    surfaces...", "MeanOut":"Various written Surfaces" "Role":"Listeners, Readers"},
                    {"activity":"Notes discarding", "MeanIn":"Notes", "MeanOut":"Nothing or
                    Integrated notes","Role":"Compilers, heirs"}, {"activity":"Printing",
                    "MeanIn":"Notes", "MeanOut":"Reference books" , "Role":"Printers"}, ];
This data structure fits to the relational database model seen above and can thus
be easily built in a client (browser). Then, in the client side, we only have to
perform some appropriate d3js function calls (using
the functional property of the JavaScript language)
such as:
var svg = d3.select('#graph') .append('svg') .style('width', 2000)
                    .style('height',1000);
to create a SVG plane, and:
svg.selectAll('rect.activity') .data(sipoc) .enter() .append('rect')
                    .attr('class','activity') .attr('x', xBarPosition) .attr('y', function (d,i)
                    {return ((i+1)*yBarPosition);}) .attr({width: widthBar, height: heigthBar,
                    style:"fill:#cb842e;stroke-
                    width:"+strokeArrowActivity+";stroke:#a00c0c"});
to create an activity block.
In figure 10, we reproduced the result obtained automatically by the code given
in appendix. For the sake of clarity, we have represented only a few dimensions
of the flowchart (in black arrows) relative to the web page edges.
Conclusion
In this article, we proposed a solution derived from a combination of several
best practices in order to account for scholarship evidence of professional
historical works. The best practices we are pointing at come either from the
industrial management process, from the software development and from the
critical distance that we must take to produce a relevant visualization of a
scholarly work. Concerning this latter point, we carried out tests of our
solution on two different topics that were objects of investigations by
historians, namely the production of knowledge and the question of
counterfeiting in the Renaissance. We saw that the SIPOC-flowchart representation gives an overall view of a case study that
resulted from a scholarly work. It gives an insight to the shape and structure
that constrain the practices of a community. But we also argued that building a
SIPOC-flowchart helped us raise problems and
questions that we did not anticipate before, in the sense that our
representation suggests (through the blanks that it left) solving and answering
particular problems.
Last, we think that it is very likely that any other work involving process or,
more generally speaking, solidarity between different actors in a specific
social context would be easily translated into the Digital Humanities field by
our solution. Indeed and in a practical way, once we have properly designed a
database to represent data coming from historical works, we open the door to the
web ecosystem and to all the features it offers. In particular, we can imagine,
following Moretti’s call for a worldwide collaboration [
Moretti 2005], research programs that would involve scholars in
collaborative relationships for modeling and providing data in a
process-oriented view as we discussed above.
APPENDIX: PROTOTYPE FOR AN AUTOMATIC FLOWCHART GENERATION
Works Cited
Blair 2010 Blair, A., 2010. Too much to know: managing scholarly information before the modern
age , New Haven: Yale University Press.
Booton 2006 Booton, D.E., 2006. Notes on
Manuscript Production and Valuation in Late-Medieval Brittany. The Library, 7(2), pp.127–153.
Codd 1972 Codd, E.F., 1972. Further normalization of
the data base relational model. Data base systems,
pp.33–64.
Cohen and Rosenweig 2006 Cohen, D.J. &
Rosenzweig, R., 2006. Digital history: a guide to
gathering, preserving, and presenting the past on the Web,
University of Pennsylvania Press. Available at:
http://chnm.gmu.edu/digitalhistory/.
Dorandi 2000 Dorandi, T., 2000. Le stylet et la tablette: dans le secret des auteurs
antiques, Paris: Les Belles Lettres.
Duclos-Mounier and Nativel 2014 Duclos-Mounier, P. & Nativel, C. eds., 2014. Copier et
contrefaire à la Renaissance: faux et usage de faux, Paris: H.
Champion.
Jeggle 2014 Jeggle, C., 2014. Copier et
contrefaire des textiles au temps de la Renaissance. In P. Duclos-Mounier &
C. Nativel, eds. Copier et contrefaire à la Renaissance:
faux et usage de faux. Paris: H. Champion, pp. 293–306.
Kurz 2007 Kurz, J.L., 2007. The Compilation and
Publication of the Taiping yulan and the Cefu yuangui. Extrême-Orient Extrême-Occident, pp.39–76.
McCarty 2005 McCarty, W., 2005. Humanities Computing, Basingstoke: Palgrave
Macmillan.
Moretti 2005 Moretti, F., 2005. Graphs, maps, trees: abstract models for a literary
history, London.
Oakes 2013 Oakes, D., 2013. Performance Metrics: The Levers for Process Management, Amer
Society for Quality.
Rever 2013 Rever, H., 2013.
Applying the DMAIC Steps to Process Improvement Projects:
Define-Measure-Analyze-Improve-Control is the “roadmap” to improving
processes International Institute for Learning, Available at:
http://www.allPM.com.
Scott 2012 Scott, J., 2012. What is Social network analysis?, London: Bloomsbury
Academic.
Thomas and Ayers 2014 Thomas, W.G. & Ayers,
E.L., The Differences Slavery Made: A Close Analysis of Two American
Communities. Available at:
http://www2.vcdh.virginia.edu/AHR/ [Accessed December 12,
2014].