Abstract
Digitization has changed flow music radio. Competition from music streaming services like
Spotify and iTunes has to a large extend outperformed traditional playlist radio, and the
global dissemination of software generated playlists in public service radio stations in
the 1990s has superseded the passionate music radio host. But digitization has also
changed the way we can do research in radio. In Denmark digitization of almost all radio
programming back to 1989, have made it possible to actually listen to the archive to
investigate how radio content has changed historically. This article investigates the
research question: How has the distribution of music and talk on the Danish
Broadcasting Corporation’s radio channel P3 developed 1989-2019 by comparing a
qualitative case study with a new large-scale study. Methodologically this shift from a
close listening to a few programs to large-scale distant listening to more than 65,000
hours of radio enables us to discuss and critically compare the methods, results,
strengths and shortcomings of the two analysis. Previous studies have demonstrated that
Convolutional Neural Networks (CNNs) trained for image recognition of spectograms of the
audio outperforms alternative approaches, such as Support Vector Machines (SVMs). The
large-scale study presented shows that the CNN-based approach generalizes well, even
without fine-tuning, to speech and music classification in Danish radio, with an overall
accuracy of 98%.
1: Introduction
In the collective research project,
A Century of Radio and Music in Denmark
financed by the Independent Research Fund Denmark (2013-2018), eleven researchers
investigated the present status and the historical development of Danish public music
radio. The project demonstrated, among many other things, how digitization has changed the
flow of music radio in several ways. Competition from music streaming services like
Spotify and iTunes challenges traditional playlist radio, and the dissemination of
software-generated playlists in public service radio stations in the 1990s has superseded
the passionate music radio host [
Have 2018]
[
Krogh 2018]
[
Wallevik 2018] (see also [
Dubber 2014]). As opposed to music
radio, talk radio is experiencing an increasing popularity in synergy with on-demand
podcast formats. And while music radio channels are bleeding listeners, these years
national governments and public debates around the world discuss whether music radio
should still be viewed as a public service and receive public funding [
Michelsen et al. 2018b].
As a part of the Danish research project, Have investigated the hypothesis that there has
been a development from recorded music being the most important content to an increasing
emphasis on spoken words (chattering hosts, news etc.) on Danish public service music
radio. This hypothesis was tested, discussed, and to some extent also confirmed, in a
qualitative study of five case studies of the most popular Danish morning music show on
the radio channel P3 in the period 1989-2016 [
Have 2018]. P3 is a public
service music radio channel broadcasted nationwide in Denmark and the equivalent of, for
example, the Swedish P3, the Norwegian P3 and the British BBC Radio 1. In this article we
investigate this hypothesis from a quantitative perspective, by extending the data from
five case studies to 65,000 hours of music radio at P3.
Digitization is not only changing radio but it is also paving the way for new areas of
radio research. Radio archives are being digitized all over the world as a part of a
preservation policy regarding cultural heritage and some of these archives allow access
for researchers. Even if archive politics are becoming more user-friendly, there is still
a need for developing tools for engaging with the overwhelming amounts of material in the
audio archives [
Michelsen et al. 2018b, 9]. Access to digital archives has
changed radio studies and media studies in general. First, by making it possible to
actually listen deeply to the archive and investigate how radio content and expression
have changed historically and thereby also enabling corrections and rewriting of existing
radio history [
Michelsen et al. 2018a]. Humanities scholars are skilled and have
many tools at hand in doing deep hermeneutic and aesthetic content analysis. But the
existing digital archives and improvement of metadata also opens open up new possibilities
of large-scale analysis and enables us to listen both closely and at distance to the
archive.
The terms close and distant listening are inspired by Franco Moretti's concept of distant
reading [
Moretti 2013]; in this article these terms will refer to two
different methodological approaches to audio analysis. By close listening we understand a
human sensorial listening, manual registering, and hermeneutic interpretation of audio
material. The strength of this method is the possibility to dive deeply and detailed into
the data, which require a limited amount of material, which in this context means a few
selected radio programs. Distant listening, on the other hand, refer to a methodology
where computational models are developed to do the “listening” for you,
so to speak, because the amount of data is too big for human sensorial processing. The
strength is here the width in listening to a huge amount of radio programs in the archive
focusing on simple categories such as music and speech.
In sound studies the term “deep listening” has previously been used to
describe a concentrated and contemplative listening mode [
Bull and Back 2003] and
Charles Bernstein has used the term in relation to poetry analysis (1998). Tanya Clement
has introduced the term distant listening, as we use it here, as a methodological term in
digital humanities to describe large-scale machine-processing of audio data [
Clement 2012]
[
Clement 2016]
[
Clement et al. 2013]
[
Mustazza 2018]. Large-scale analysis of audio data is still quite rare in
Digital Humanities compared to textual and visual analysis. Most of the existing audio
analysis deal with recordings of text associated with the field of literary studies. In
Musicology the field of Music Information Retrieval (MIR) has been growing the last few
years as a part of the broader field of Audio Content Analysis (ACA)
[1], but in Media Studies large-scale audio
analysis are still rare.
The present study's point of departure is the Danish digital radio archive and digital
infrastructure
LARM.fm, which gives access to
almost two million digitized Danish radio programs. No tool has yet been developed for
large-scale analysis of the archive, and one of the ambitions behind the project presented
in this article is to demonstrate a way to do just that. Thus, the aim of the article is
twofold: 1) To describe the methodological process and challenges for developing a model
for large-scale Speech-Music discrimination analysis on audio data to answer the research
question
How has the distribution of music and talk on the Danish Broadcasting
Corporation's radio channel P3 developed (1989-2019)? 2) To discuss and
critically compare the methods, results, strengths and shortcomings of the qualitative
case study and the large-scale analysis, respectively.
In the following we will first present the LARM.fm archive that serves as the basis for
both studies. After that we shortly present the analogue hand-held case study first
presented in the article “A Lost Link between Music and Hosts: The
Development of a Morning Music-Radio Show”
[
Have 2018] — we will call it
the case study in this article.
Hereafter we present the new big data study —
the large-scale study — in
relation to methodological processes and challenges and analytical results. In the section
that follows we discuss and compare the two studies and the strengths and weaknesses of
close listening and
distant listening methodologies, and the
article ends with a short conclusion.
2: LARM.fm a digital archive and infrastructure
LARM.fm was originally developed by the research project LARM Audio Research Archive
(2010-2014), which was a collaboration between 10 research and cultural institutions
funded by the Danish Ministry of Higher Education and Science. Since 2015 LARM.fm has
formed part of the national project DIGHUMLAB, www.dighumlab.org. The infrastructure was
then recreated on the present HTML5 platform, and the platform was expanded to also
include TV [
Have and Nielsen 2016, 2].
Since 1987 Denmark have had legal deposit of all broadcast material to the Royal Danish
Library which is included in the Danish Media Collection. From 2005 onwards, this material
has been exclusively born-digital and almost all analogue programs from 1989 to 2005 have
been digitized. Due to legal protection the Media Collection is only available to the
public through on site computers at the libraries. However, an agreement between The
Danish Agency for Culture and the copyright holders allows university faculty and students
to stream, but not to download, the material through the library's platform Mediestream or
LARM.fm.
As opposed to Mediestream LARM.fm also contains older material from the archives of the
Danish Broadcasting Corporation (Danmark's Radio or DR in the following), dating back to
1925, when the national radio was launched in Denmark. The old material is incomplete and
consists mostly of text documents, as many programs were not saved, and others (still)
have not been digitized [
Have and Nielsen 2016, 3]. Besides access, LARM.fm also
provides various search tools and opportunities for organizing, annotating and sharing
material.
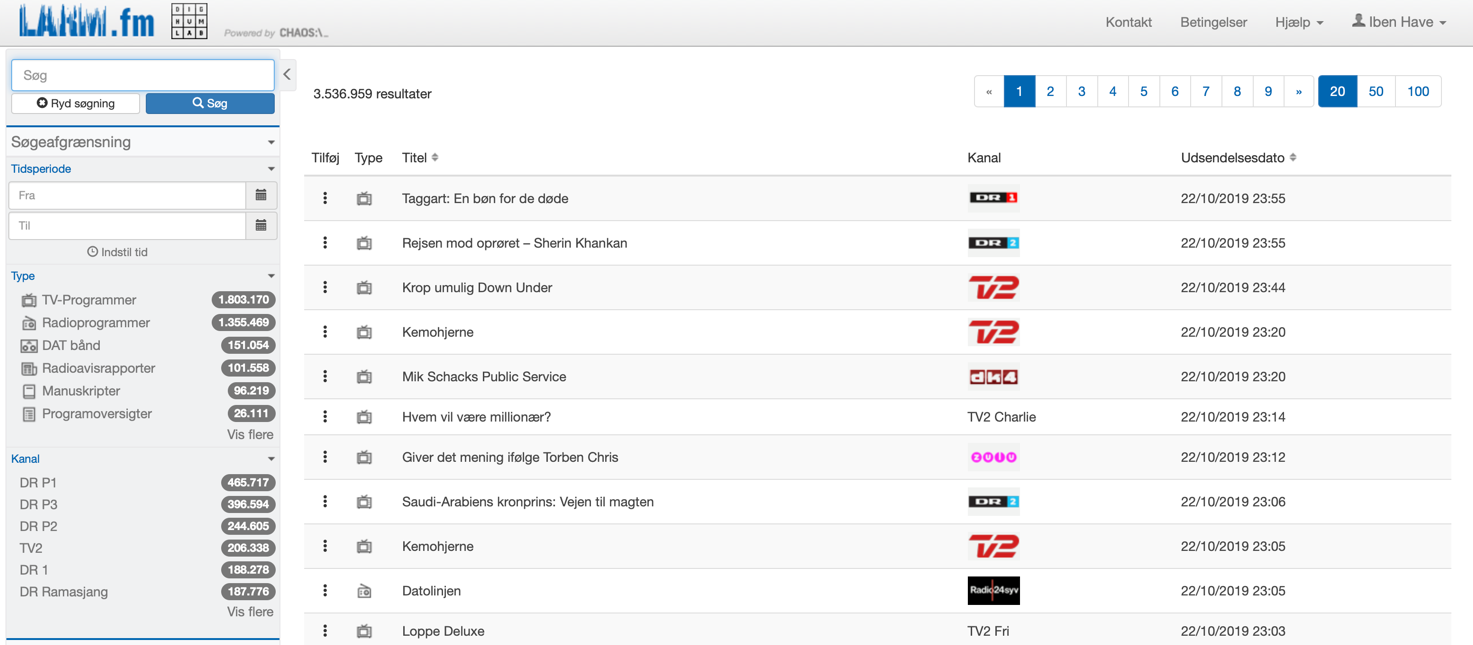
The amount of available material grows proportionally as new Danish radio and TV programs
are broadcasted in Danish media. In November 2019 the collection consisted of more than
three million radio and TV programs and more than 200,000 OCR-scanned PDF files .
As shown in
Figure 1 (left column) the material is arranged
according to type: TV programs, Radio programs, Radio news reports, Radio news
manuscripts, Program guides, Radio news guides. Radio- and TV programs are available for
streaming the other types of material consist of PDF files containing OCR-scanned
documents — some handwritten and others typed or printed.
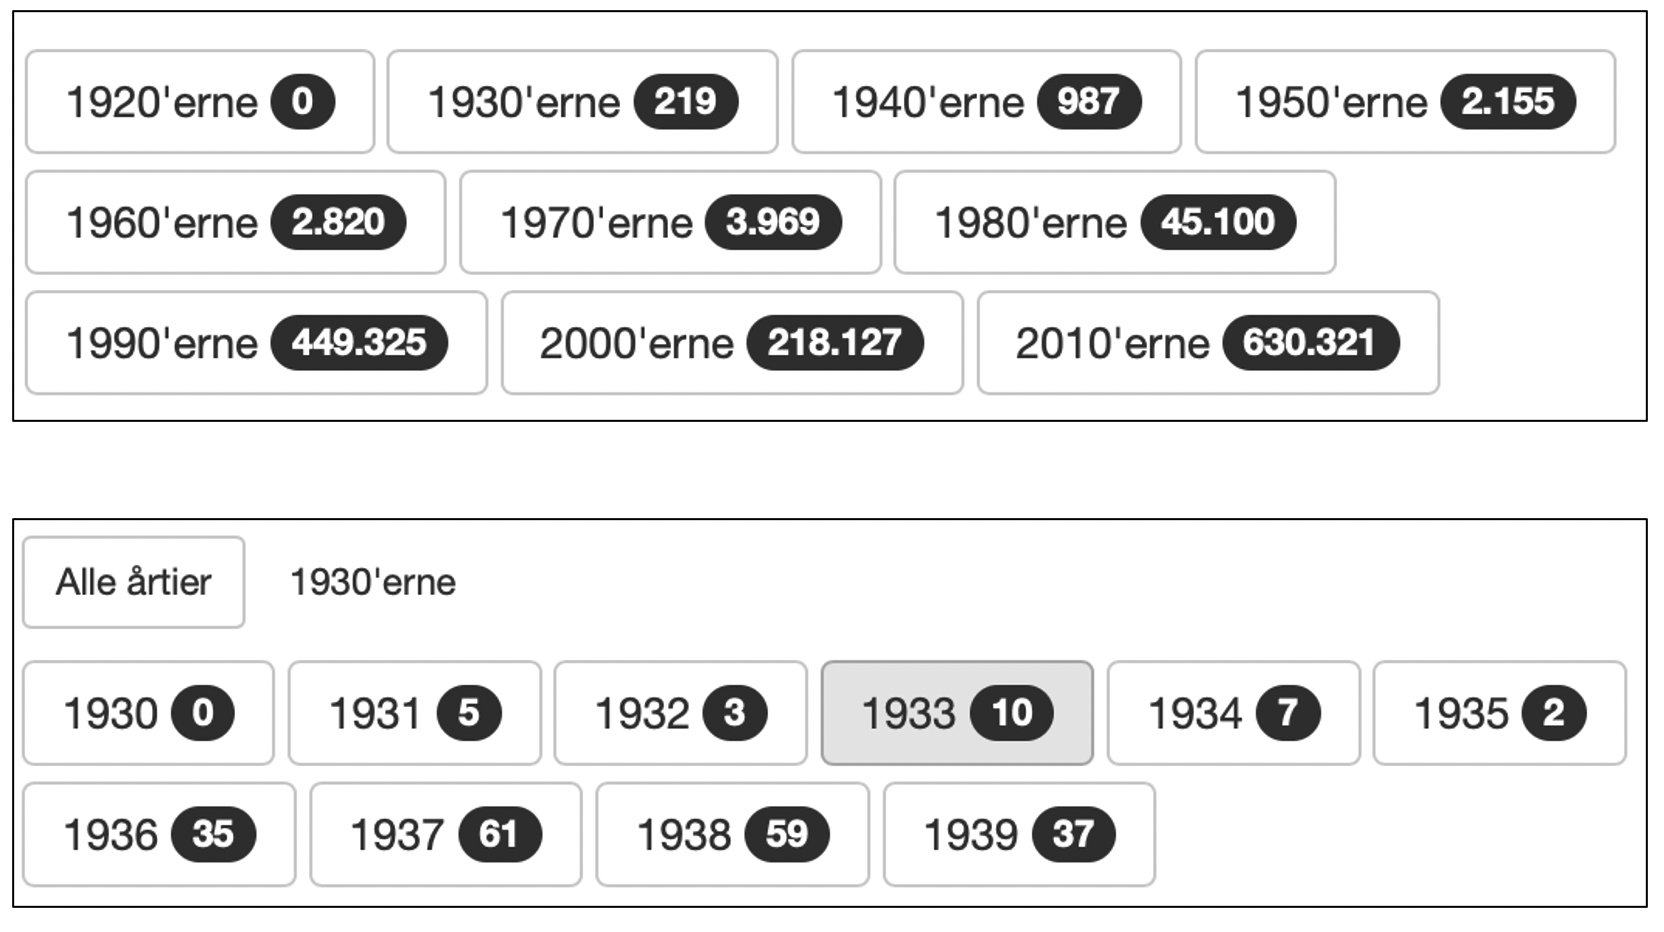
The oldest radio program in the archive is from 22 May 1931 and lasts just over five
minutes. As illustrated in
Figure 2b there are 10 or fewer
programs from the first five years and between 35 and 61 programs from the remaining years
in the 1930s.
[2]LARM.fm has expanded Danish radio research towards deep and detailed content analysis of
first-hand sources, which has been requested not only in Danish radio research but
internationally within media studies, where radio studies used to be characterized by
institutional and media systemic analysis [
Michelsen et al. 2018b]. Research access
to archives and digital tools such as LARM.fm makes it possible to do deeply and broadly
contextualized synchronic analysis because it enables us to study what was broadcasted
simultaneously, before and after a given event or a specific program. However, archives
especially call for historical diachronic analysis of longer time-spans and affords unique
possibilities for coupling qualitative and quantitative methods and analysis. The
following is an example of such a study combining an already existing qualitative study
[
Have 2018], with a large-scale study presented for the first time in this
article. The combination of human close listening to the LARM.fm-archive and distant
machine listening to the very same archive also prepare the ground for discussions of
methodological strengths and challenges in Digital Humanities.
3: The case study
The close listening case study of the development of the share of music and speech
focuses on the most popular music radio program Go' Morgen P3 (Good Morning
P3) broadcasted on the national radio channel P3. The channel has existed on the frequency
modulation band (FM) since 1963 and Go' Morgen P3 was launched in November
1989 playing music from 6 to 9 a.m. on weekdays. Except from a shifting variety of hosts
and host constellations the program appears rather stable during the decades.
The aim of the case study was to test the hypothesis that from 1989 to 2016
Go'
Morgen P3 developed from having recorded music as the most important content of
the programs (qualitatively as well as quantitatively) to have increasingly emphasis on
speech and entertaining hosts. In Have (
2018) this
hypothesis was discussed in the light of the introduction of computerized playlists and
rotation systems in Danish public service radio in the 1990s, as well as the increasing
competitive situation, involving commercial and digital radio stations and, not least,
digital music streaming services. In this article we will only present selected results
and methods from the case study relevant to the large-scale study.
We listened closely to five selected
Go' Morgen P3 programs broadcast
between 6 and 9 a.m. on Wednesdays close to 1 November covering a period of 25 years.
First, the programs were roughly annotated by Have using the categories music, speech,
other to get a first impression of the results. The category 'speech' includes only speech
of the hosts and interviewees, while the category 'other' covers news, sport, weather
forecasts, jingles, channel advertisements etc. Then the counting was independently
validated and fine-tuned by student assistants.
[3] Choosing the same weekday at the same time of the year renders yearly
comparisons more valid and Wednesdays around 1 November are not influenced by bank or
festive holidays. The aim was to ensure that the five programs were evenly distributed
throughout the time span, but due to few accessible programs from the first years of the
millennium in the LARM.fm archive it ended up with five programs from 1992, 1998, 2006,
2011 and 2016 respectively [
Have 2018].
To ensure that the program from 1992 was representative for the early 1990s and not
affected by the institutional restructuring and formatting of radio channels in DR that
year, registrations from the previous years were included for comparison: 31 October, 1990
and 30 October, 1991. As shown in
Figure 3, the distribution
between the categories was rather even, which confirmed that 1992 was not different from
the previous two years. Unfortunately, the program from 2006 appeared to be unusual
because it has technical problems in the studio, which gave rise to the use of some
unplanned “rescue music” during the first 15 minutes, and therefore the
music takes up more time than expected. However, that was discovered so late in the
process that we kept it in the case study.
The registrations of the content of the five/seven programs point to some stable as well
as evolving elements during the period. The basic format remained fairly stable over the
years, but there were significant changes in the content of
Go' Morgen P3 and
the relations between music and hosts. During the 25 years there was a change from one
host's talking filling out the gaps between the musical tracks to music as something
filling out the gaps between a group of 3-4 hosts. However, as shown in
Table 2 there were only a slight decrease of recorded music but
in general more host speak during the years. The analysis showed that the amount of speech
has increased, but not so much to the detriment of music (as expected) as to
“other”
[
Have 2018].
However, a close listening to the programs revealed that the emphasis on music
in the talk has gradually been disappearing. The time spent on introducing
the music decreases radically and the link between the music and the hosts has
correspondingly weakened during the past 25 years, finally disappearing from the program
in 2016. The five/seven examples illustrate that in the early 1990s there was a strong
connection between the music and the host, who chose the music and to some extent scripted
speech of him- or herself. And almost everything said between the tracks was about the
music. After the introduction of playlists in the 1990s, this link was terminated, and the
presentation is minimized in 2011 from “Chris Brown, With
You” to a total disappearance in 2016.
Some elements of content are identical in all five programs namely the recorded music,
the time announcements and channel/program adverts, but new, entertaining elements that
are not related to music (satire, quizzes, and everyday news and actuality) are gradually
introduced. This development together with the hosts' ignorance towards the music is
pushing the music further into the background.
| Date/Category |
4 Nov. 1992 |
28 Oct. 1998 |
25 Oct. 2006 |
2 Nov. 2011 |
2 Nov. 2016 |
| Speak |
10.28 minutes |
26.48 |
46.3 |
55.52 |
51.5 |
| Music |
116.52 |
92.5 |
100.32 |
91.45 |
101.95 |
| Other |
42.22 |
51.07 |
28.63 |
26.15 |
22.5 |
Table 1.
Go' Morgen P3 programs in minutes divided between content categories.
On the basis of the findings from the case study, it was concluded that Go' Morgen
P3 evolved from being a radio program with a strong focus on music or at least
with music as the most important content, to a program focusing on light, entertaining
news and chatter of the hosts. This changed the status of the program from being a clear
music-radio format where the recorded music is clearly significant and essential to being
a more blurred soft-news format, where music takes many different roles, not only as
musical pieces but also as underscore music and jingles important to the flow of the
program. These observations enabled by a close listening to the programs combined with
knowledge of Danish media politics and institutional changes in DR are of relevance for
the large-scale analyses presented in the following section. Instead of relying on a
small, curated and hand-annotated sample, this study utilizes thousands of radio programs
to test the qualitative observations on data from LARM.fm. The study represents the first
large-scale audio analysis in the Danish Media Collection.
4: The large-scale study
In this study we take the existing study further by zooming out and letting a computer do
the “listening” and “counting” — not on five/seven
case studies but on a sample of the whole morning programming of P3 1989-2019 including
the Go' Morgen P3 schedule.
[4] The study has been guided by the following research questions: How has
the distribution of music and talk developed 1989-2019? How much music and how much
speech? (classification). How long are the sequences with speech/music?
The corpus for analysis is all radio programs broadcasted at P3 1989-2019 between 6 a.m.
and 12 a.m. and available as audio files in the Danish Media Collection and accessible
through LARM.fm. The data in the corpus is divided in two corpora, resulting from
different digitization processes: 1) Digitized radio files 1989-2005. 20,660 programs from
1989-01-01 to 2005-06-30 and 2) Born digital radio files 2005-2019. 24,456 programs from
2005-07-20 11:05:00 to 2019-05-28 14:03:00.
[5] Since the material is copyright-protected, we made a processing agreement
with the Royal Danish Library which allowed us to retrieve digital copies of the
audio-files from the Media Collection needed for the project.
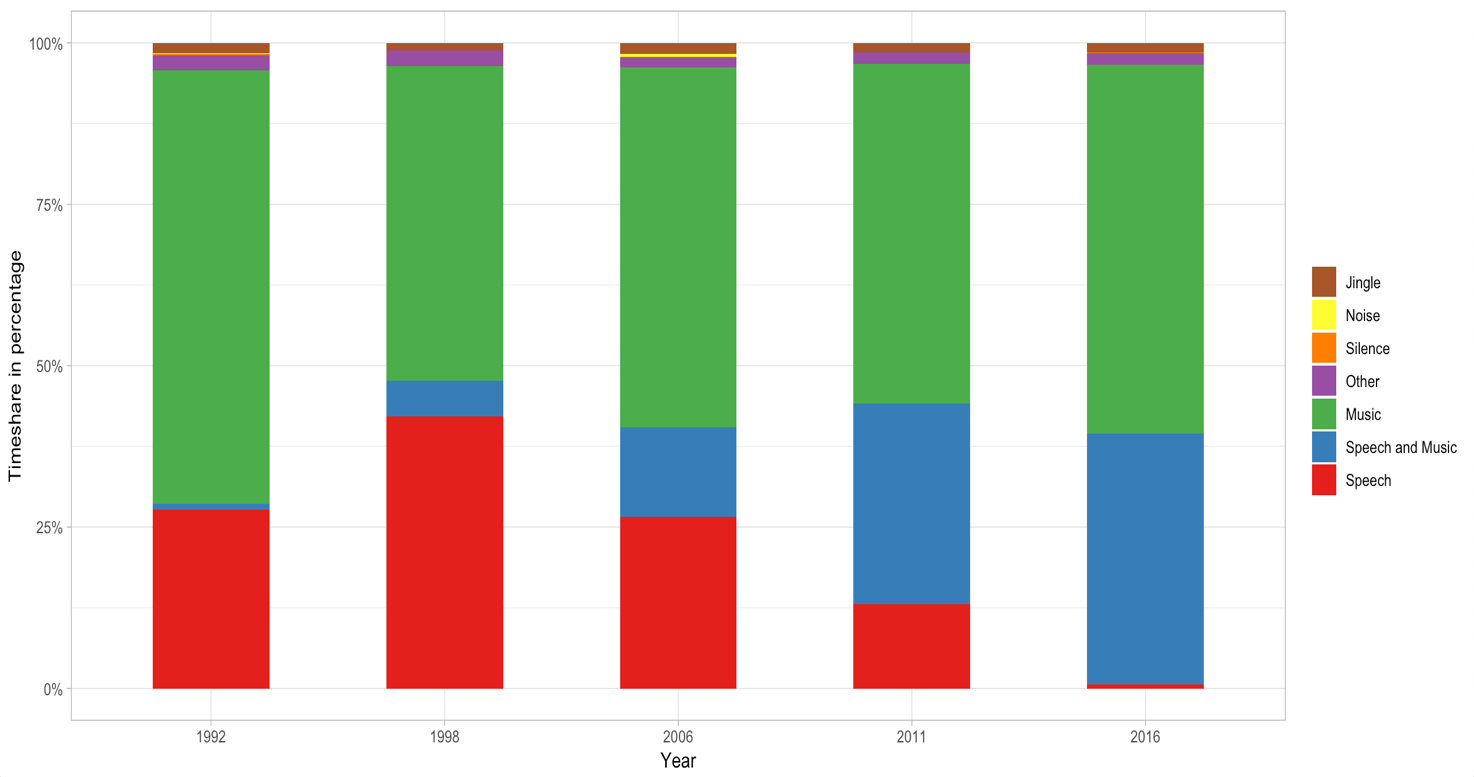
First, we repeated the manual coding of the five programs from the case study — this time
through the open source multi-track audio editor and recorder Audacity — to be able to
test the performance of a large-scale analysis. Doing the coding on the same material
twice enhanced the reliability and as you can see by comparing
Figure 4 with
Figure 3 the diagrams are quite
consistent from 2006-2016. However, the comparison also revealed some errors, since there
is a discrepancy in 1992 and 1998. So, we went back to LARM.fm to deep-listen to the
programs and found some external program segments with more speech than usual in Go'
Morgen P3 were included in the data. Those smaller inconsistencies further add to the need
for quantitative analysis in cohort with a qualitative approach.
In the next step we utilize the trained model by Papakostas and Giannakopoulos
(2018)
[6] for Speech-Music discrimination, in which it is shown that a convolutional neural
network (CNN) image-based classification on spectrograms obtain state-of-the-art
performance. This model was trained by applying transfer-learning from a CNN trained on
subset of the Imagenet [
Deng et al. 2009]. In this approach each audio file is
broken into overlapping mid-term segments of 2.4 seconds with a step of 1 second. A
spectrogram is then derived for each segment after which the CNN trained by Papakostas and
Giannakopoulos (
2018) is used to discriminate between
speech and music. Followingly, a median filter was used to smooth the signal. This could
e.g. remove 1-second segments of speech in music, which is naturally very
unlikely.
[7] During testing, this image classification approach yield accuracy of
approximately 93-98% on 11 hours of radio stream [
Papakostas and Giannakopoulos 2018], while
state-of-the-art audio-based classifiers obtain a performance of approximately 85-94%. For
more on how the model was trained, its performance and audio to spectrogram preprocess we
encourage the interested reader to examine the original study by Papakostas and
Giannakopoulos (
2018).
As seen in
Table 2 and
Figure
5 these performance levels generalize well to Danish when comparing it with our
coded dataset. For a comparison with an audio-based classifier we used the support vector
machine (SVM) by Giannakopoulos (
2015).
|
Audio-based Classifier (SVM) |
Image-based Classifier (CNN) |
| Accuracy (95% CI) |
0.92 (0.920, 0.925) |
0.98 (0.979, 0.982) |
| Balanced Accuracy |
0.94 |
0.98 |
| Sensitivity |
0.98 |
0.99 |
| Specificity |
0.90 |
0.97 |
| Pos Pred Value |
0.80 |
0.94 |
| Neg Pred Value |
0.99 |
0.99 |
| No Information Rate |
0.70 |
0.70 |
Table 2.
Performance using only the Speech and Music categories. Positive class is set as
speech for reference.
These performance levels include only pure categories of speech and music, which does not
represent the music radio programs, especially not after 2006 (see
Figure 4) in which it is seen that the proportion of the mixed category speech
and music is increased. Including “Speech and music” in the
“speech” category and “jingles” in the
“music” category, we see that the CNN obtains an accuracy of 0.96
(95% CI: 0.954, 957). Note that this includes categories which are unpredictable by the
CNN, such as noise and silence. Therefore, this is the likely performance which we will
see over all categories, given the assumption that jingles are music and “speech
and music” is speech.
This level of performance allows for large-scale analysis of the relationship between
speech and music and while our approach focuses on speech and music classification in
radio, it can be generalized to other audio media and audio recordings such as podcasts,
audiobooks and music performances. It is also possible to alternate predictors and, for
instance, include gender and mood and allow for multiple outcomes, such as speech, music
and jingles.
The results of the analysis are shown in the following four Figures, which will be
further discussed in the following section.
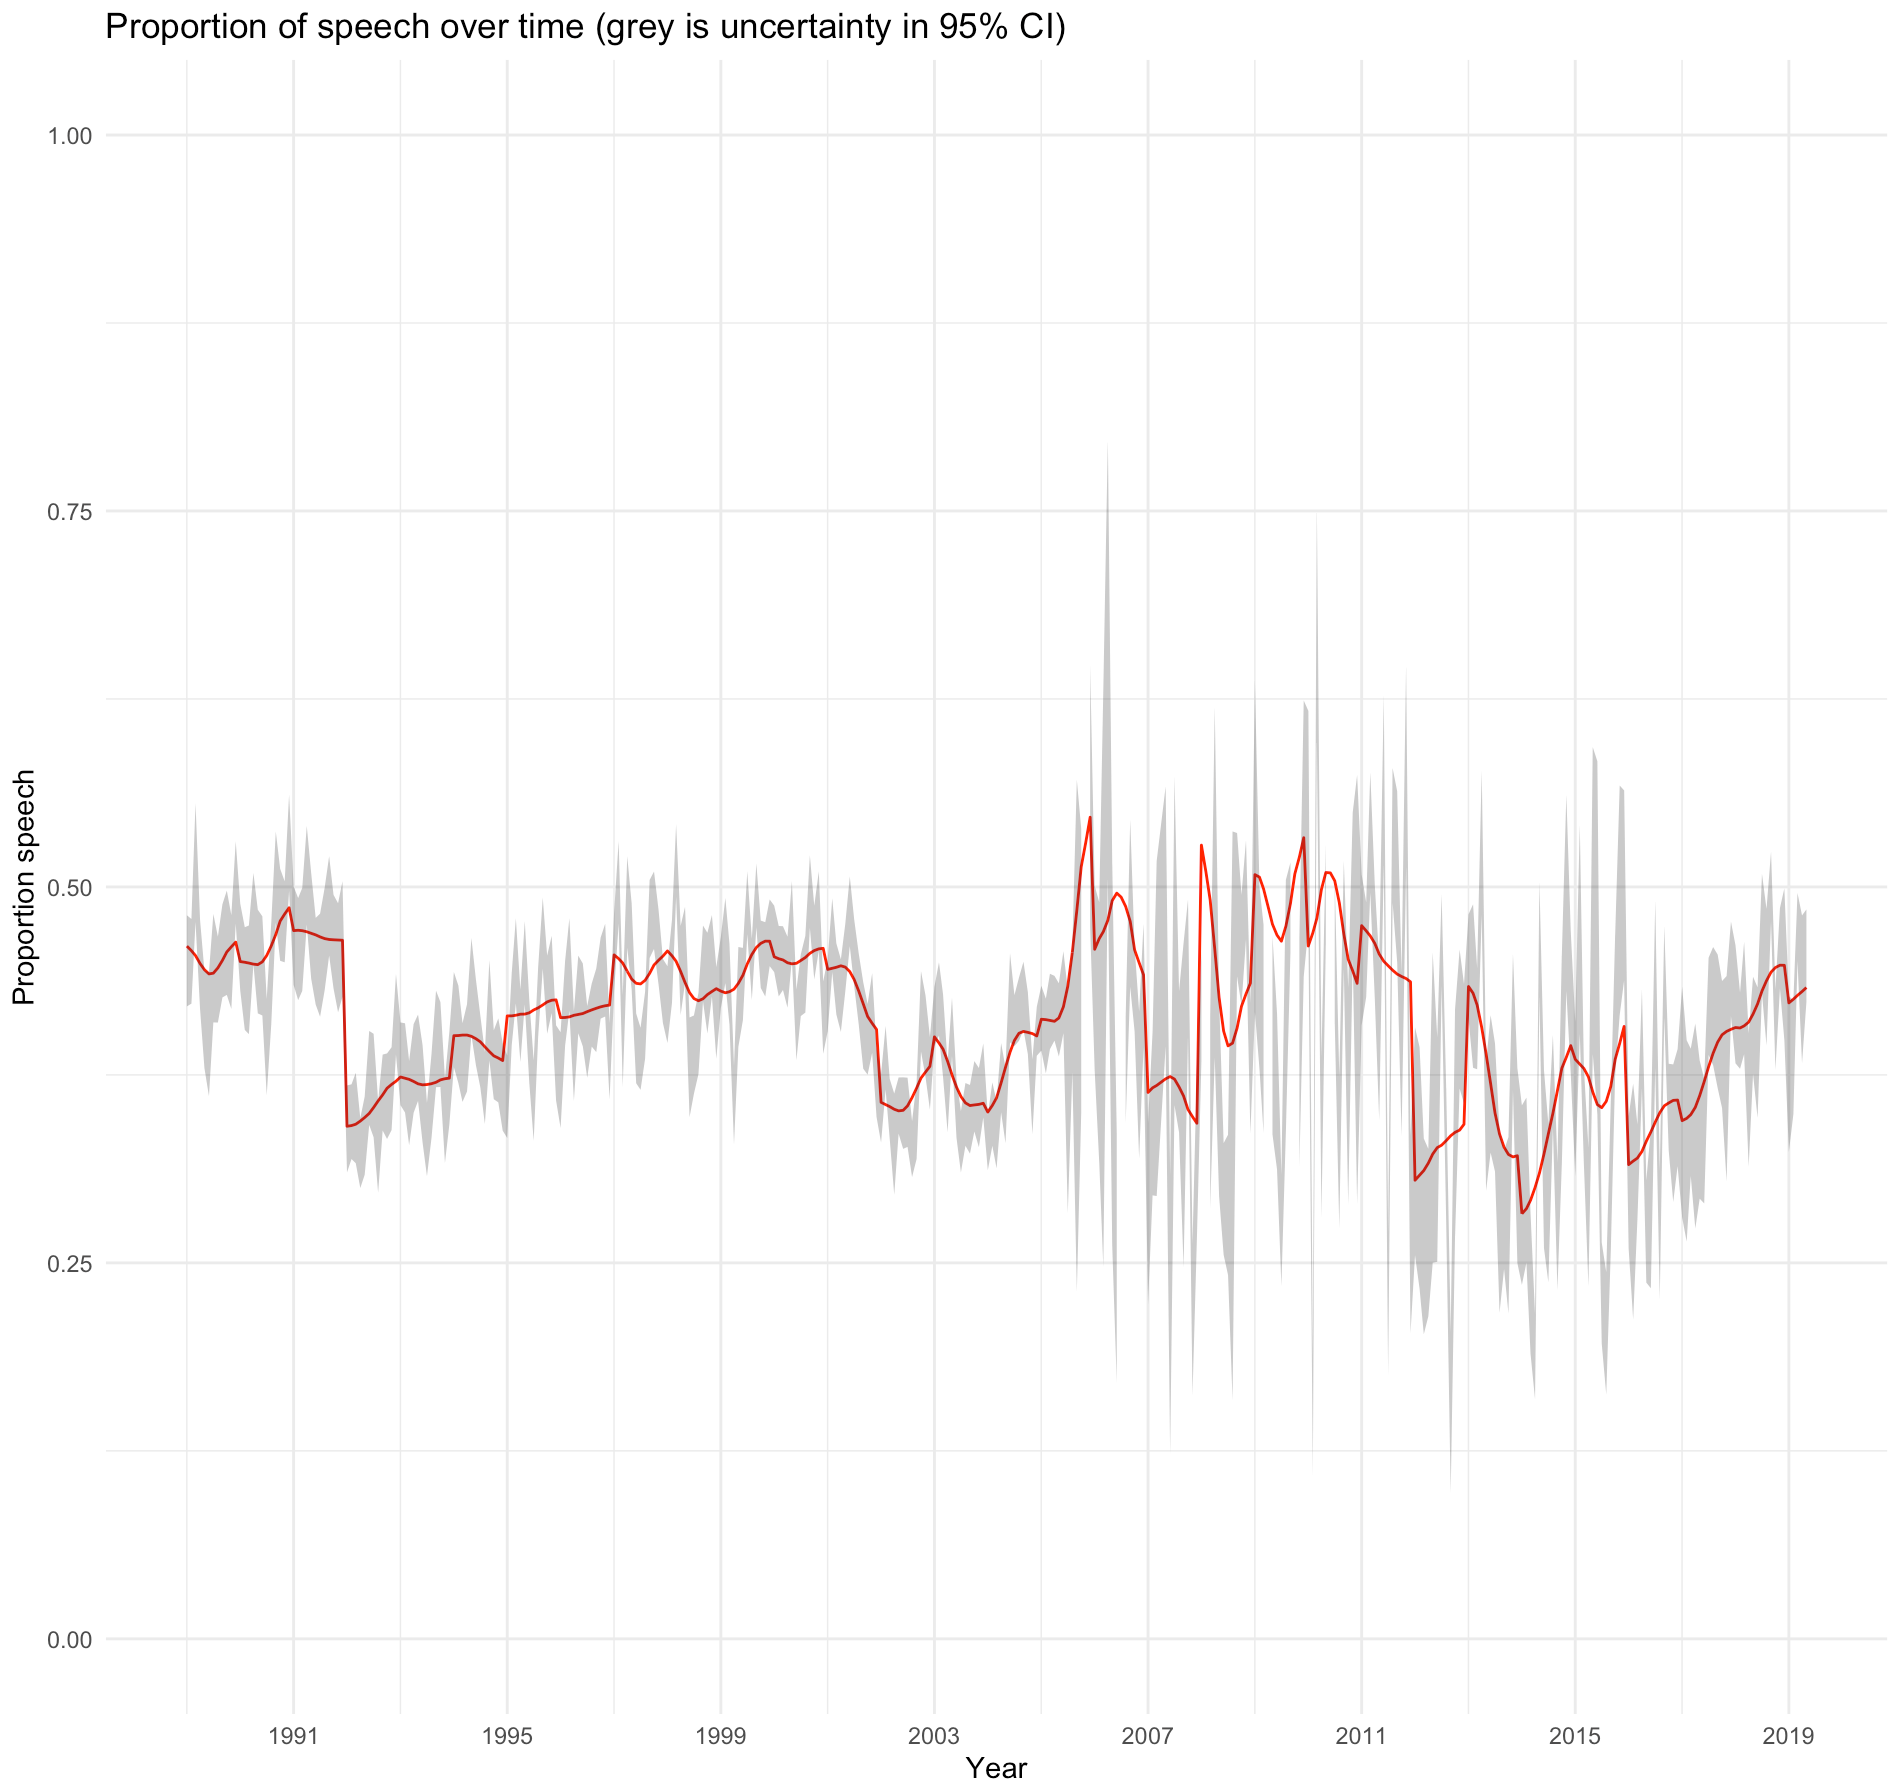
In
Figure 6 we measured the changes in the proportion of
speech during the thirty years and notice significant changes around 1992 and 2001 and
again in 2005. We also see an upward trend from 2016-2019.
Apart from the Music-Speech discrimination we also have an interest in how the length of
the sequences with speech/music might change during the years. This interest came from the
findings in the case study showing that the length of a musical track has been
standardized, especially after the introduction of playlists, rotates systems and musical
clock-schemes [
Russo 2013].
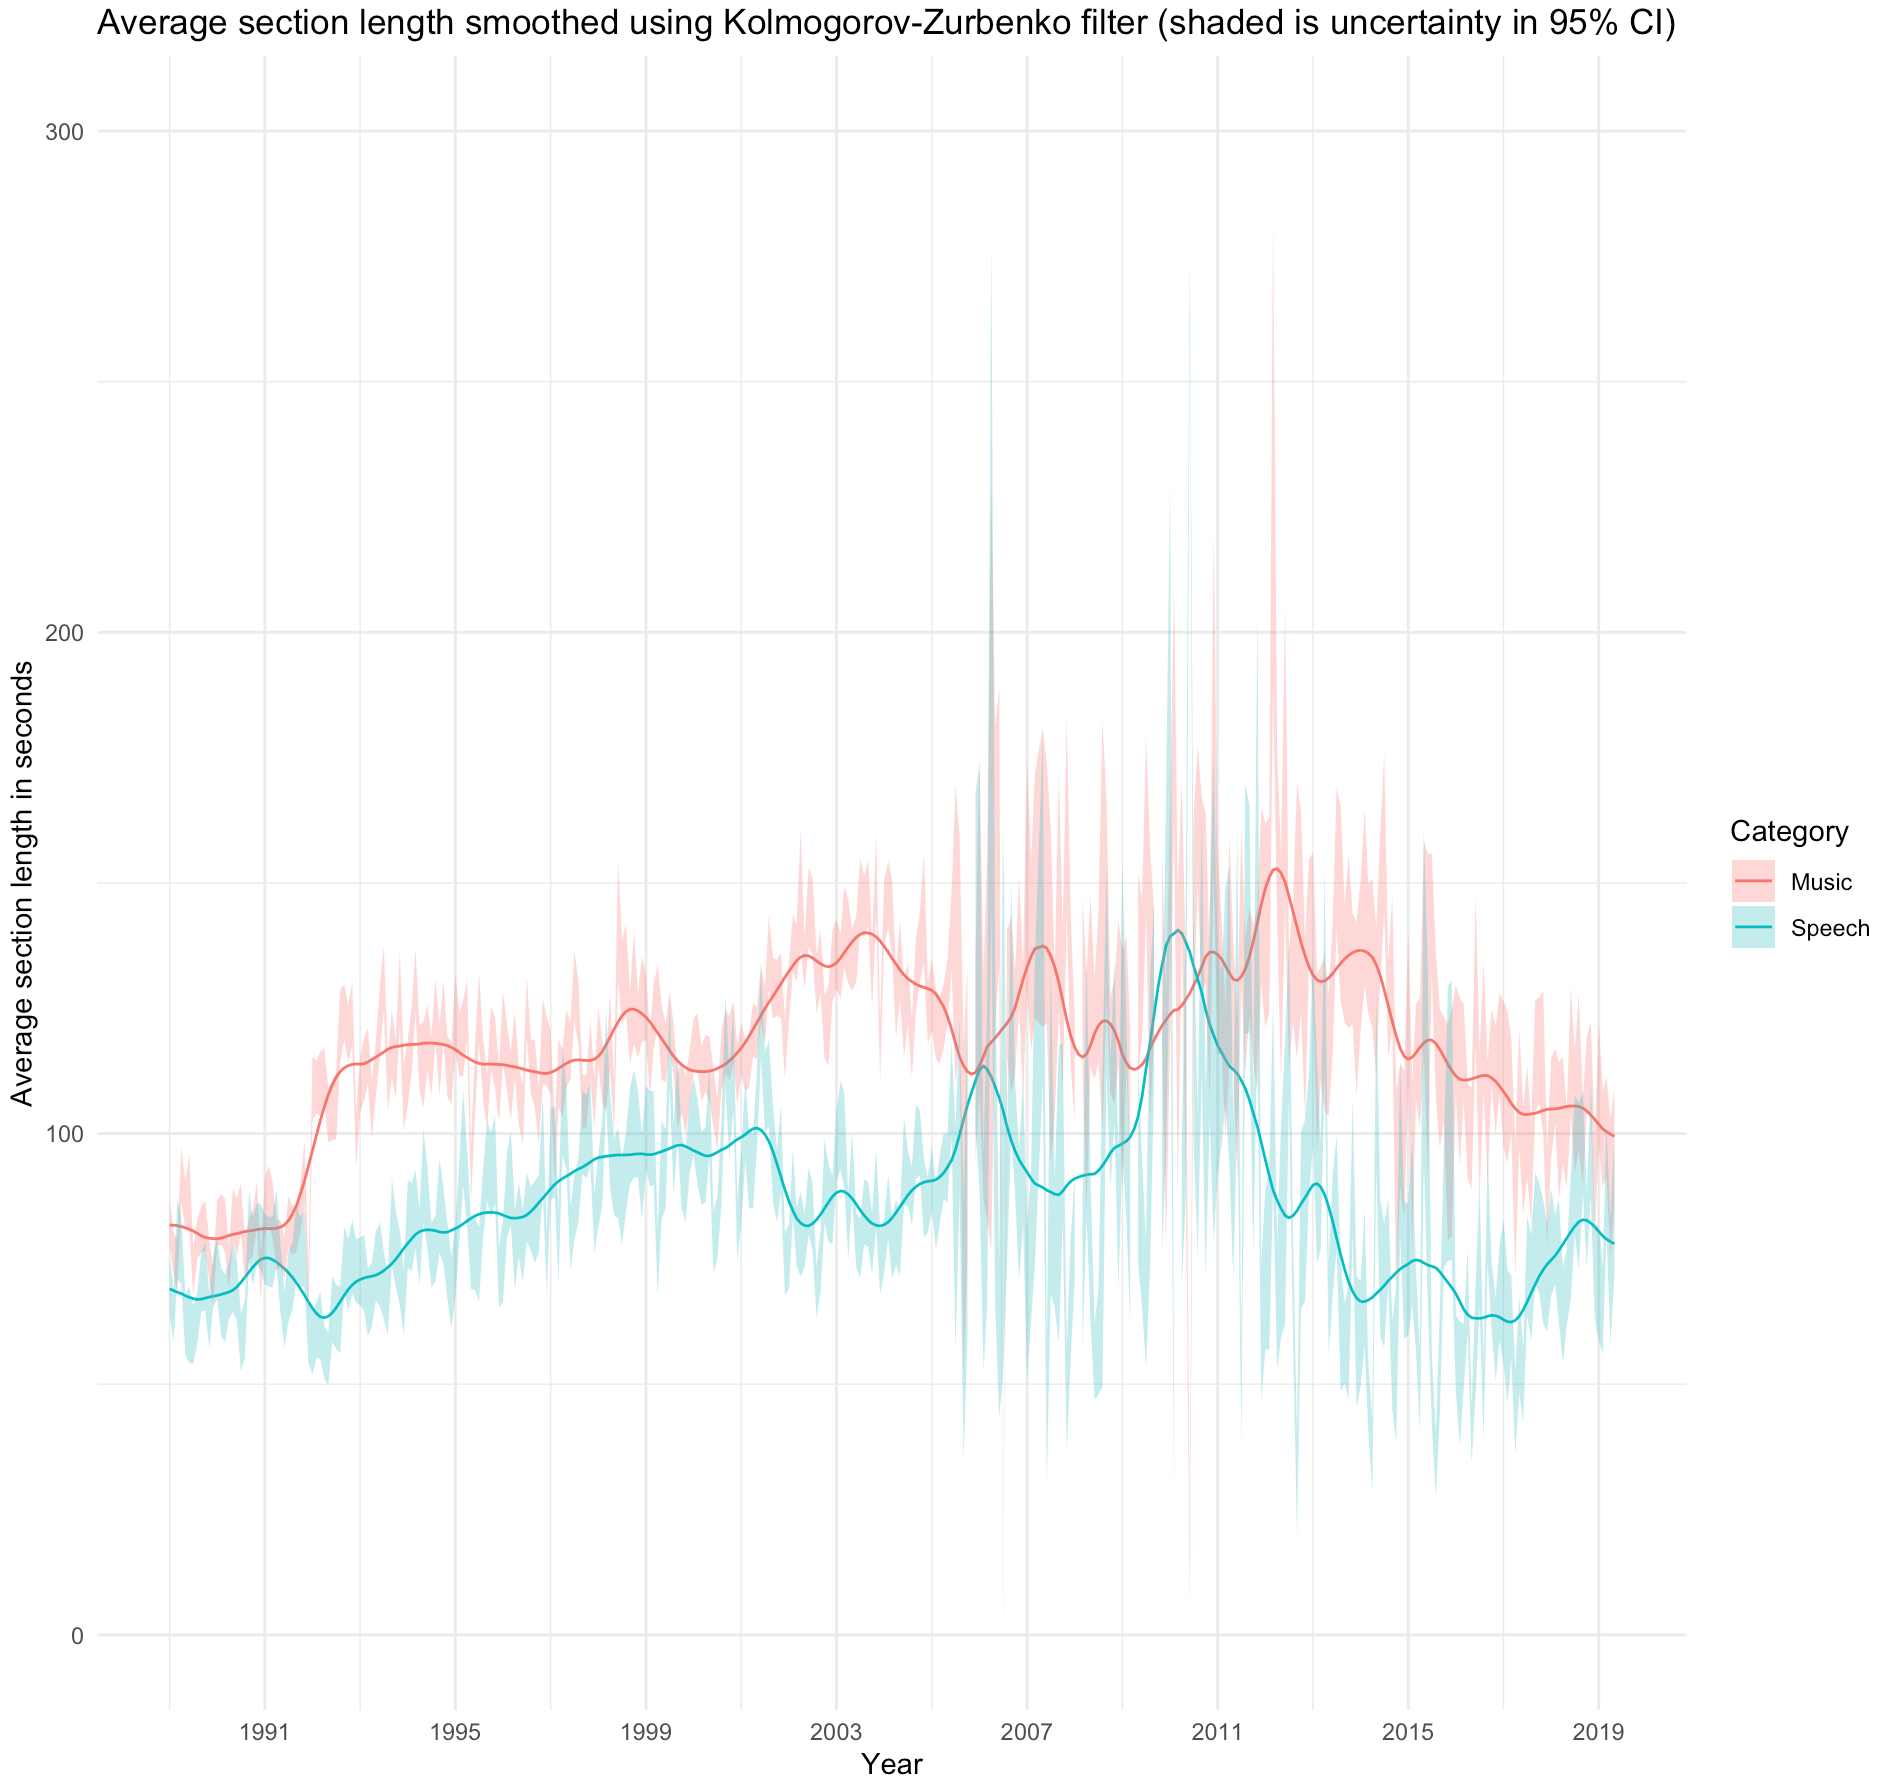
Because we in
Figure 7 present the mean length in seconds,
the distribution is rather a Poisson distribution for speech and for music — a
distribution which resembles a bimodal Poisson distribution (see
Figure 8 and
Figure 9). Note the increase in the
average length of music in 1992 and the decline in music and speech length from 2011,
which seems to indicate that there are shorter segments of both speech and music and
consequently they must have switched more often. Additionally, we observe a rise in
average speech length from 1992 until 1999.
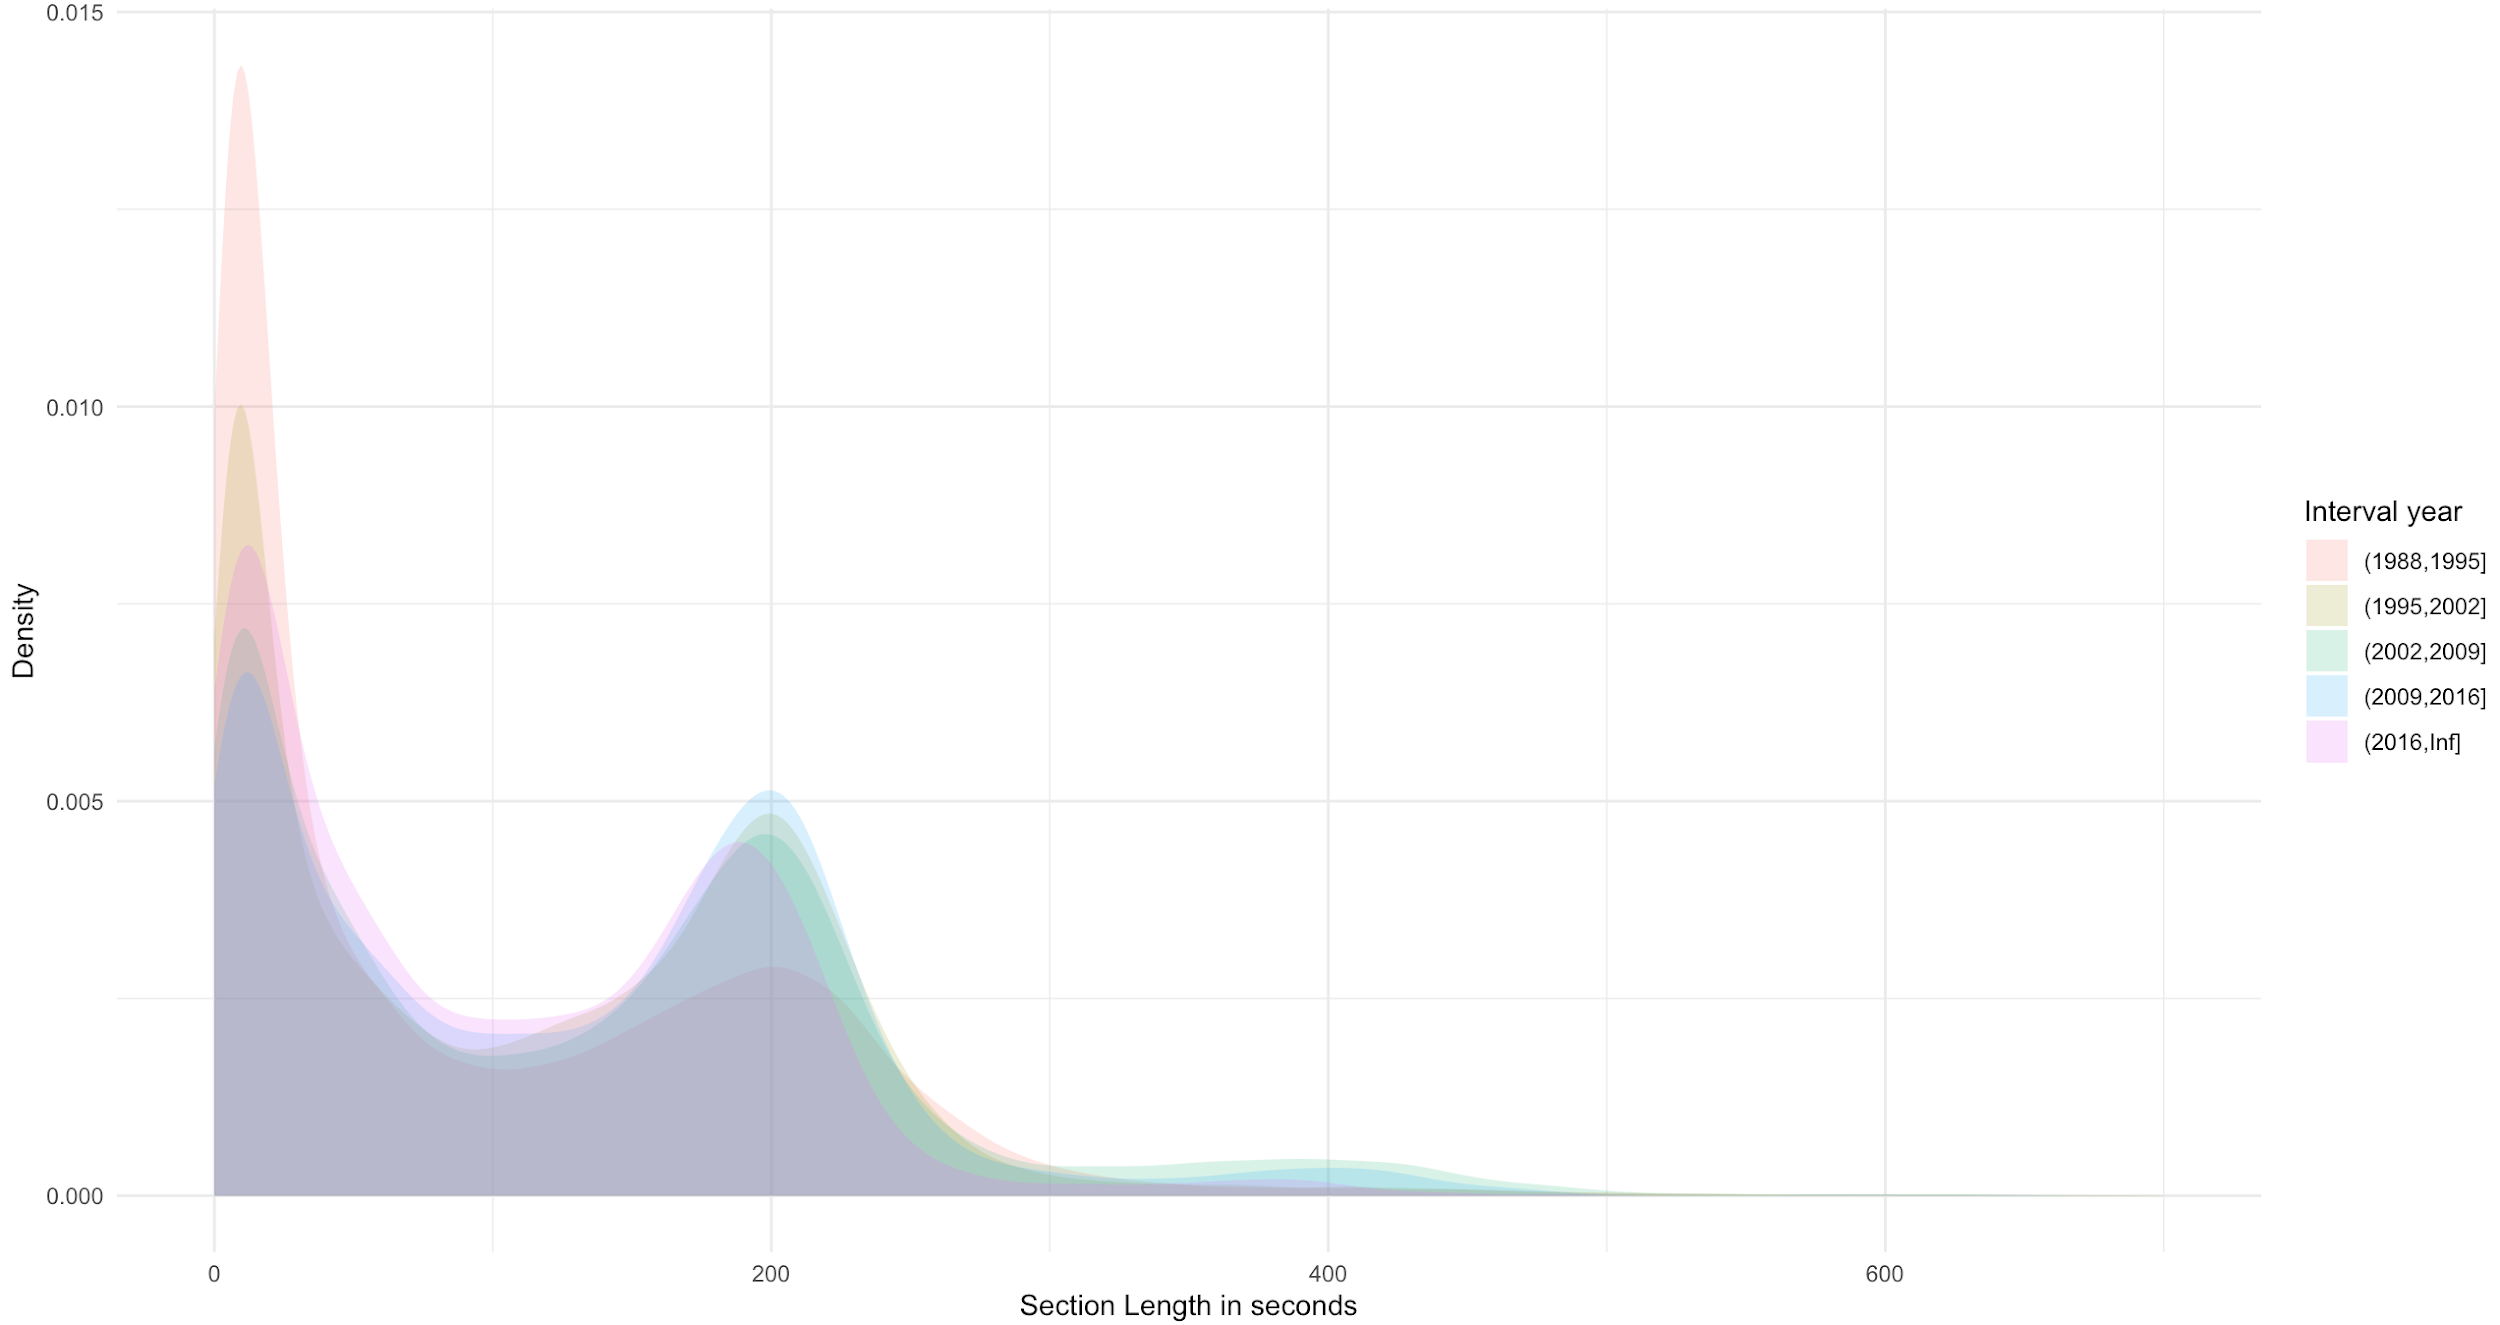
To elaborate the findings from
Figure 7 we grouped the
numbers in seven-years-periods to make comparison of these segments in relation to speech
and music, separately.
In
Figure 8 and
Figure 9 we
pay attention to the first peak of very short segments of 10-20 seconds and the second
peak around the 200 seconds - especially significant in relation to music.
5: Discussion and comparison with qualitative study
The study has analyzed some general tendencies in the development of the morning
programming 6-12 a.m. at P3 1989-2019 by measuring the proportional distribution of music
and speech and by measuring the length of music and speech segment respectively. When we
look at the most visually striking changes in Figures 6 - 9, some years across the
analysis seems note-worthy: 1992, 2001, 2005 and 2016.
Some important institutional and media political changes must be taken into account to
explain the development. The official end of the monopoly in Danish radio came in 1983
when local radio stations were allowed for the first time; however, with regard to
nationwide channels DR's monopoly was not fully broken until 2003. That means that P3 has
been in an increasing competitive condition during the thirty years, which is further
intensified by the competition from music streaming services like Spotify and iTunes from
the latter half of the 2000s.
To meet the competition from the local and commercial music radio channels, P3's profile
was strengthened with the formatting of DR's four radio channels in 1992 (P1, P2, P3 and
Danmarkskanalen (from 1997: P4). Together with a more market-oriented
strategy, a controversial playlist tool for music control was introduced and slowly
implemented together with rotation systems during the 1990s, meaning that the music
presenter no longer chooses the music for the program. This systematization and a
standardization of the lengths of musical tracks might explain the increase in the average
length of music in 1992 supported by the increase in segments of music around 200 seconds
after 1995 in
Figure 9.
If we look at
Figure 6, we see significant changes around
1992 and 2001 and again in 2005. This generally confirms the case study in relation to the
tendency of less speech in the early 1990s before the restructuring and formatting of DR's
radio channels in 1992, and a growth peaking around 2011 and hereafter a decreasing
tendency towards 2016. What is new in the large-scale study is, that we here see an upward
trend in the proportion of speech from 2016 to 2019 reflecting a corresponding decrease in
musical content.
The rise in the proportional amount of speech from 2005 to 2011 in Figure 6 can be
explained by the increasing number of hosts in the studio (Figure 10). More hosts entail
more talking. Have (
2018) found that there were many
different hosts in the early years but only one host in the studio at a time (1989-2000),
after which there was a relatively stable group of hosts of three to four who were all
co-present in the studio (2005-2015). In the intervening years there was a short period
with one or two hosts in the studio (2001-2004) [
Have 2018, 132f].
The changes in 2005 might also be explained by a change in file format in the dataset.
That year The Danish State Media Collection's procedure changed from digitizing the
incoming material from the Danish media providers, to receiving it as born-digital as
described above. While this change is positive, it leads to analysis on individual
programs rather than the entire morning section. This leads to files which predominantly
is music or speech hereby leading to increased uncertainty. To normalize across corpora
each file was further split into segments of approximately 1,000 seconds leading less
effect of outliers, however a noticeable difference still remains between the corpuses. As
seen in
Figure 8 and
Figure 9,
hardly any sections of music or speech is above 1,000 seconds. But we must still take an
increase in uncertainty after 2005 into account.
In
Figure 7 we see an increase in the average length of
music from 1992 and a decline in music and speech length from 2011, which seems to
indicate that there are shorter segment of both speech and music in the early years which
might to some extend be explained by the practice of the host overlapping with the music
and consequently music and speech are switching more often. The shift in 2011 might be
explained by a general use of jingles and segments like quizzes and DR's own commercials.
However, that does not correspond with
Figure 4 showing a
more stable category of “Other” between 2011 and 2016. The rise
in average speech length from 1992 until 1999 can be explained by the fact that DR in
relation to the reorganization in 1992 introduced more entertaining and chatty news
communication as a part of Go' Morgen P3, which occupy half of the morning programs during
the thirty years. In general, P3 after 1992 turned from being a purer music channel
towards a more entertaining and communicative channel.
In
Figure 8 and
Figure 9 we
pay attention to the first peak of very short segments of 10-20 seconds, which again can
be explained by the overlapping host talk in the early years, and the second peak around
the 200 seconds — especially significant in relation to music. This observation is
interesting because it confirms a standardization in the lengths of musical tracks played
in the radio after the restructuring in 1992. It is an example of what Have (
2018) calls a
radiotization of music, which means
that the logic of radio dictate parts of the creative processes of the musicians. In other
words: If you want to be played in the radio, you must compose tracks close to 3 minutes
and 20 seconds to fit into the flow of the musical clock structure. The clock format is
based on the structure of an hour divided in segments of speech and music (see e.g. [
Hendy 2000], 94ff for an introduction to the so-called clock format [
Michelsen et al. 2018a, 192f]
[
Russo 2013]). The structure of well over 3 minutes per segment has proven
to be the best to maintain the listeners on the channel — a perfect balance between
recognizability and renewal. As the playlists in the case study show, the variation in the
music became narrower after the introduction of the playlist tool, and as shown in
Figure 9 the length of the individual sections of music have
become more stable during the years confirming a more controlled and computer-calculated
playlist and structure.
Apart from the specific results of the changes in the Danish radio channel P3, this
article also has an interest in the methodological discussions of deep and distant
listening. The opportunity to move back and forth between the existing case study and the
large-scale study — you might call it a meso scale listening approach — has made the
analysis not just more solid in relation to the existing findings but also in relation to
filling the gaps of each method. Risks of cherry picking in relation to the qualitative
case study have been dismissed, and
Figure 6 added a more
nuanced perspective to the case study by showing a quite variable amount of speech during
the years. However, with an upward trend from 2016-2019, which is the period not included
in the case-study. So, the large-scale study also gave rise to new questions, such as, why
do we see an increasing amount of speech from 2016 and onwards? An explanation could be
the increasing competitive situation, both from commercial digital music radio stations
and digital music streaming services. In this competitive field of musical content DR and
P3 turn towards one of their core competences as a public service institution, to offer
professional journalistic content presented by well-known young personas in an
entertaining way. That strategy turns P3 even more away from being the music channel it
once was towards an entertaining and communicative radio channel.
Many of the eye-catching changes in Figures 6-9 can be explained from institutional
changes in DR, but the significant change in 2005 cannot. That gave rise to questioning
not the classifier but the data, which changed format in 2005. This is valuable knowledge
not only in this study but in future large-scale studies of the LARM.fm archive. Working
with the LARM.fm archive as reverse-engineering Humanists has given insights in some of
the challenges of large-scale archive analysis calling for critical attention to
significant oscillation, which is not always anchored in the actual changes in the content
of the data but in the formats providing this content.
A main aim of this study in total has been to analyze whether there has been a
development from recorded music being the most important content to an increasing emphasis
on spoken words. The close listening approach enabled a study of how the music was
presented by the hosts in the program and confirmed the qualitatively change from a host
filling out the gaps between the musical tracks by talking about the music in the early
1990s to music as something filling out the gaps between a group of hosts, who do not
relate to the music at all. However, the large-scale study enabled us to correct or at
least nuance the findings further by demonstrating that the general amount of speech has
actually not increased but is varying during the 30 years period, as shown in
Figure 6. From the large-scale study we learned that the
diachronic changes in the share of music and speech are less significant than initially
expected. This points to the fact that picking single case studies (even if sampled
deliberately) can lead to doubtful conclusion if not reflected on a background of the full
radio programming. At this point our study clearly shows strengths and weaknesses of the
two approached and why it generates more valid answers to combine them.
6: Conclusion: Combining close to distant listening
This study has compared a case study of five Danish music radio programs (1990-2016) to a
large-scale study of the whole morning programming (6 to 12 a.m) of the music channel P3
1989-2019. Both studies are anchored in the data from Danish digital archive and
infrastructure LARM.fm, which is offering new paths for radio and media studies by
affording deep listening studies as well as large-scale distant listening studies. The
study is the first to present a large-scale analysis of the huge amount of data from the
Danish radio archive. Inspired by Papakostas and Giannakopoulos we applied a convolutional
neural network (CNN) image-based classification on spectrograms, which was obtaining
state-of-the-art performance. For a comparison with an audio-based classifier we used the
support vector machine (SVM) by Giannakopoulos (
2015). As demonstrated in
Table 2 and
Figure 5 the classifier tools developed from Papakostas and
Giannakopoulos performed with high accuracy and the performance levels generalized well to
Danish. This is useful insight to bring into future studies of automated speech
recognition in Digital Humanities: For instance, how the analytical results found in a
small amount of data can successfully be generalized to a large amount of data, and how
models of speech-music discrimination can successfully be transferred across languages
(Danish and English in this case). We also expect that the model developed in this article
can be trained in relation to other tasks such as gender detection or regional accent
detection.
The findings in the study confirms that the political and institutional changes in Danish
music radio leave their imprint in the content of the programs. For instance, when we
register more standardized formats and segments after the restructuring in 1992. But the
most eye-catching protrusion of
Figure 6 in 2005 must be
explained by a change of format caused by a shift from digitized to born digital files in
the archive. Thereby the study also contributes with an example of how it is important to
include reflections on the constitution and possible changes in the data when doing
large-scale analysis.
In general, we can conclude that the combination of a close listening and a distant
listening approach has given us a more saturated picture of the development of the morning
music radio programming at P3 from 1989 to 2019. The combination both enables us to give
more valid answers to how the distribution of music and talk has changed during the period
but it also brings forward some strengths and shortcomings of the qualitative case study
and the large-scale analysis, respectively. Finally, we hope that this study can
contribute to encouraging Digital Humanities scholars to include more audio content
analysis in relation to the field of Media Studies.
Works Cited
Barber 2016 Barber, J. F. (2016). “Sound and Digital Humanities: reflecting on a DHSI course”
Digital Humanities Quarterly, 10(1).
Bernstein 1998 Bernstein, C. (ed.) (1998). Close Listening: Poetry and the Performed Word. Oxford: Oxford
University Press.
Birdsall and Tkaczyk 2019 Birdsall, C. and Tkaczyk, V.
(2019). “Listening to the Archive: Sound data in the Humanities and
Sciences”
Technology and Culture, 60(2), John Hopkins University
Press.
Bull and Back 2003 Bull, M. and Back, L. (ed.) (2003).
The Auditory Culture Reader. Oxford, New York: Berg.
Clement 2012 Clement, T. (2012). “Distant Listening: On Data Visualisations and Noise in the Digital Humanities”
Text Tools for the Arts, special issue of Digital Studies / Le champ numérique,
3(2), 2012.
Clement 2016 Clement, T. (2016). “Towards a Rationale of Audio-Text”
Digital Humanities Quarterly, 10(2).
Clement et al. 2013 Clement, T. et al. (2013). “Distant Listening to Gertrude Stein's ‘Melanctha’: Using Similarity
Analysis in a Discovery Paradigm to Analyze Prosody and Author Influence”
Literary and Linguistic Computing, 28(4), 582-602.
Deng et al. 2009 Deng, J., Dong, W., Socher, R., Li, L. J.,
Li, K., & Fei-Fei, L. (2009, June). Imagenet: A large-scale hierarchical image
database, 2009 IEEE conference on computer vision and pattern
recognition (pp. 248-255). Ieee.
Dubber 2014 Dubber, A. (2014). Radio
in the digital age. Cambridge: Polity.
Giannakopoulos 2015 Giannakopoulos, T. (2015).
pyAudioAnalysis: An Open-Source Python Library for Audio Signal Analysis. PloS One, 10(12), e0144610.
Have 2018 Have, I. (2018). “A Lost Link
Between Music and Hosts: The Development of a Morning Music Radio Programme” In
Michelsen, M., Krogh, M, Have, I. and Nielsen S. K. (ed.), Tunes for
All: Music on Danish Radio, Aarhus: Aarhus University Press.
Have and Nielsen 2016 Have, I. and Nielsen, J. (2016),
User Manual for LARM.fm. A Digital Radio and TV Research
Infrastructure for Researchers, Teachers and Students, Aarhus: DIGHUMLAB.
Hendy 2000 Hendy, D. (2000). Radio in
the global age. Cambridge, Oxford, Boston, New York: Polity.
Jia et al. 2014 Jia, Y., Shelhamer, E., Donahue, J., Karayev,
S., Long, J., Girshick, R., … Darrell, T. (2014). “Caffe.”Proceedings of the ACM International Conference on
Multimedia - MM '14, 675-678.
Krogh 2018 Krogh, M. (2018). “Non/Linear Radio Genre, Format and Rationalisation in DR Programming” In
Michelsen, M., Krogh, M, Have, I. and Nielsen S. K. (ed.) (2018). Tunes for All: Music in Danish Radio. Aarhus: Aarhus University Press.
Michelsen et al. 2018 Michelsen, M., Krogh, M, Nielsen S. K
and Have, I. (ed.) (2018). Music Radio: Building Communities,
Mediating Genres. New York: Bloomsbury.
Michelsen et al. 2018a Michelsen, M., Have, I.,
Lindelof, A. Sivertsen, H. S. and Larsen, C. R. (ed.) (2018a). Stil
nu ind …: Danmarks Radio og Musikken. Aarhus: Aarhus University Press.
Michelsen et al. 2018b Michelsen, M., Krogh, M, Have,
I. and Nielsen S. K. (ed.) (2018). Tunes for All: Music in Danish
Radio. Aarhus: Aarhus University Press.
Moretti 2013 Moretti, Franco (2013). Distant Reading. Verso.
Mustazza 2018 Mustazza Chris (2018). “Machine aided close listening, Machine-aided close listening: Prosthetic
synaesthesia and the 3D phonotext”
Digital Humanities Quarterly 12(3).
Papakostas and Giannakopoulos 2018 Papakostas, M. and
Giannakopoulos, T. (2018). “Speech-Music Discrimination Using Deep
Visual Feature Extractors”
Expert Systems with Applications 114, 334-344.
R 2013 R Core Team (2013).
R: A Language
and Environment for Statistical Computing. R Foundation for Statistical
Computing, Vienna.
http://www.R-project.org/.
Russo 2013 Russo, A. (2013). “Tick Tock
goes the Musical Clock” In Loviglio and Hilmen (ed.) Radio's
New Wave. New York: Taylor and Francis.
Wallevik 2018 Wallevik, Katrine (2018). “To Go with the Flow and to Produce It” In Michelsen, M., Krogh, M,
Have, I. and Nielsen S. K. (ed.) (2018). Tunes for All: Music in
Danish Radio. Aarhus: Aarhus University Press.